Creating a Performance Chart
To create a Performance chart, follow these steps:- Navigate to the
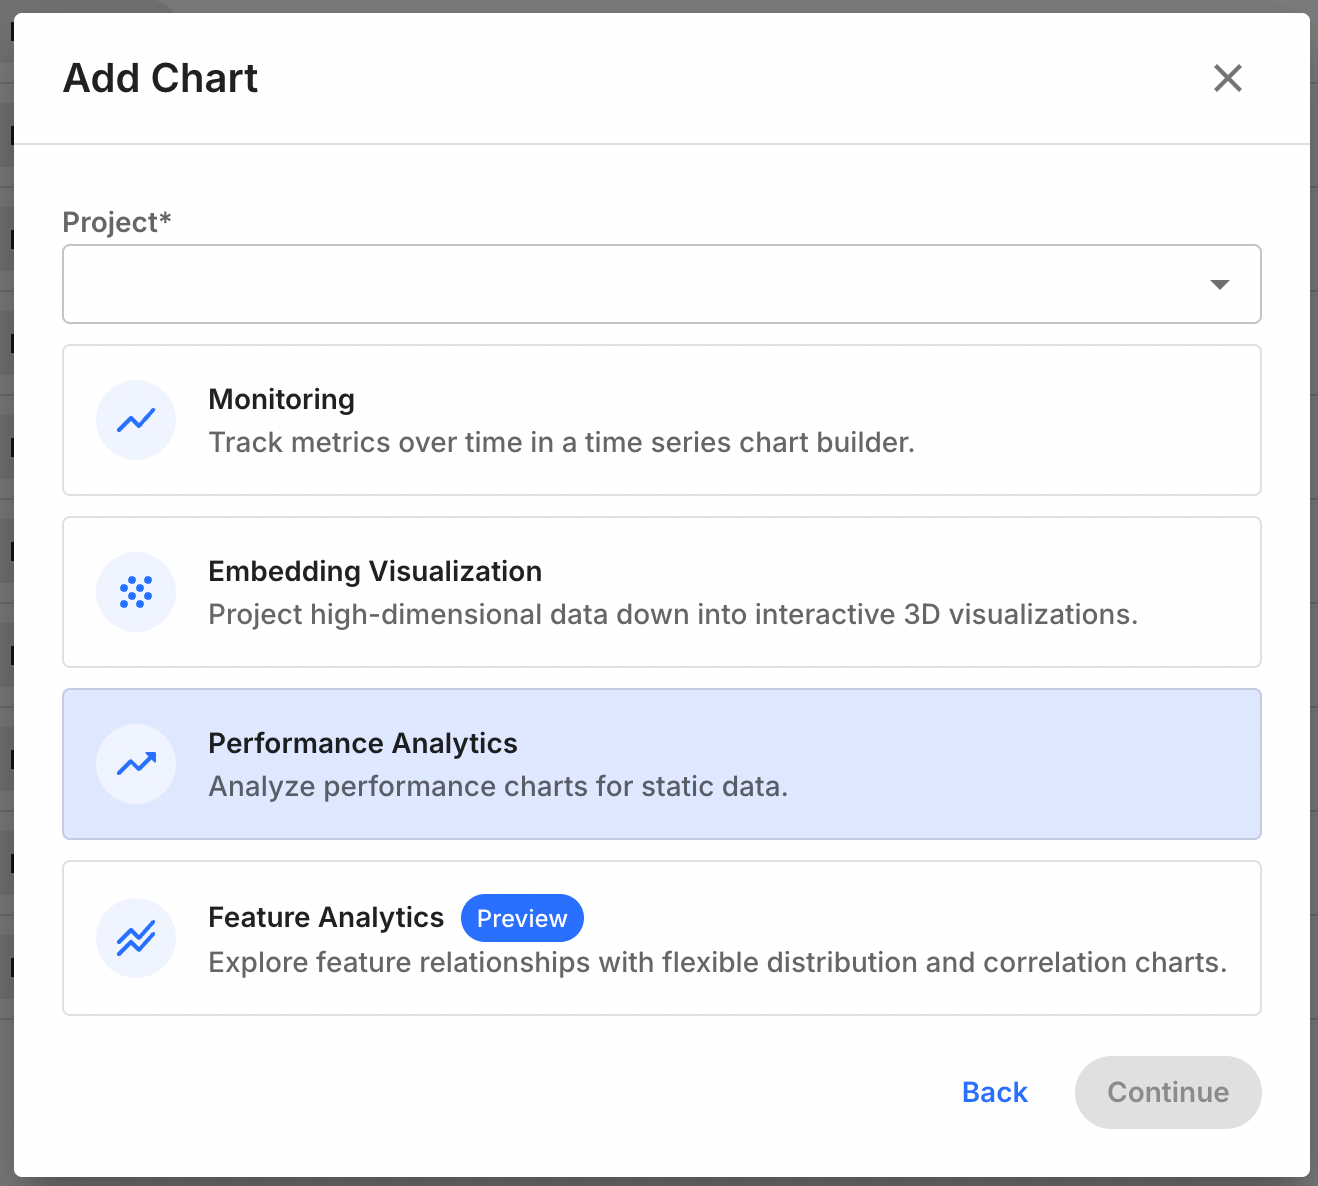
Chartstab in your Fiddler AI instance - Click on the
Add Chartbutton on the top right - In the modal, Select the project that has a model with Custom features
- Select Performance Analytics

Available Performance charts
| Model task | Available Chart(s) |
|---|---|
| Binary classification | <p>- Confusion Matrix<br>- ROC<br>- Precision Recall<br>- Calibration Plot Charts</p> |
| Multi-class Classification | - Confusion Matrix |
| Regression | <p>- Prediction Scatterplot<br>- Error Distribution</p> |
| Ranking / LLM / Not Set | Not available |
Available right side controls
| Parameter | Value |
|---|---|
| Model | List of models in the project |
| Version | List of versions for the selected model |
| Environment | Production or Pre-Production |
| Dataset | Displayed only if Pre-Production is selected. List of pre-production env uploaded for the model version. |
| Visual | List of possible performance visualization depending on the model task. |
| Segment | <p>- Selecting a saved segment<br>- Defining an applied (on the fly) segment. This applied segment isn’t saved (unless specifically required by the user) and is applied for analysis purposes.</p> |
| Max Sample size | <p>Integer representing the maximum number of rows used for computing the chart, up to 500,000. If the data selected has less rows, we will use all the available rows with non null target and output(s).<br>Fiddler select the <code>n</code> first number of rows from the selected slice.<br><br><em>Note: Clickhouse is configured using multiple shards, which means slightly different results can be observed if data is only selected on a specific shard (usually when little observation are queried).</em></p> |
Available in-chart controls
| Control | Model Task | Value |
|---|---|---|
| Time range selection | All | Selecting start time and end time or time label for production data. Default to last 30 days |
| Positive class threshold | Binary classification | Selecting threshold applied for computation / visualization. Default to 0.5 |
| Displayed labels | Multi-class Classification | Selecting the labels to display on the confusion matrix (up to 12). Default to the 12 first labels |