
Overview
Custom metrics let you define measurements that align precisely with your agentic application’s requirements. Whether tracking business KPIs, aggregating quality scores from enrichments, or computing cost and latency signals, custom metrics let you tailor observability to your specific needs. Once defined, they are available in charts and dashboards. Custom metrics for agentic applications are defined using Fiddler Query Language (FQL) and reference span attributes captured from your application’s OpenTelemetry traces. This differs from ML custom metrics, which reference model schema columns.Custom metrics can be organization-level (visible across all projects) or project-scoped (visible only within a specific project). See Metric Visibility below.
Metric Visibility: Organization vs Project
When creating a custom metric, you choose whether it is organization-level (global) or project-scoped. This determines who can see it and who can delete it, and cannot be changed after creation.Organization-level metrics
Created without selecting a project. Visible across all projects in the organization. The metric name is reserved org-wide — no other metric in the organization can share the same name.Project-scoped metrics
Created with a specific project selected. Visible only to users who have access to that project. The same metric name can be reused in a different project as long as the projects don’t overlap.The attribute() Function
The attribute() function is the GenAI-specific FQL primitive for referencing span data. It replaces the column references used in ML custom metrics.
Syntax
Reference an attribute in one of two ways — by name, its verbatim key exactly as your application sends it, or by semantic concept, which resolves consistently across instrumentation frameworks.semantic_name requires semantic mappings, which are enabled by default from release 26.16. On earlier releases, attribute() requires name, scope, and type, and rejects semantic_name — the shorthand attribute('my_attribute') shown above also requires 26.16 or later. Existing metrics written in the older form continue to work unchanged.Supported semantic concepts
semantic_name accepts the following concepts. Attributes your application defines that fall outside this list are referenced by name instead.
ttft returns the value exactly as your instrumentation emits it, so its unit depends on the source framework — some frameworks emit seconds, others milliseconds. To track overall span latency, use the built-in latency chart; system-computed span duration is not currently queryable through attribute(semantic_name='latency') in a custom metric.Type inference
Fiddler infers the attribute type from context — you do not need to declare it explicitly:- When used inside a numeric aggregate like
sum()oraverage(), the attribute is treated as a number. - When used with string functions like
length()ormatch(), the attribute is treated as a string. - When the
valuekeyword is provided, the attribute is always treated as a string.
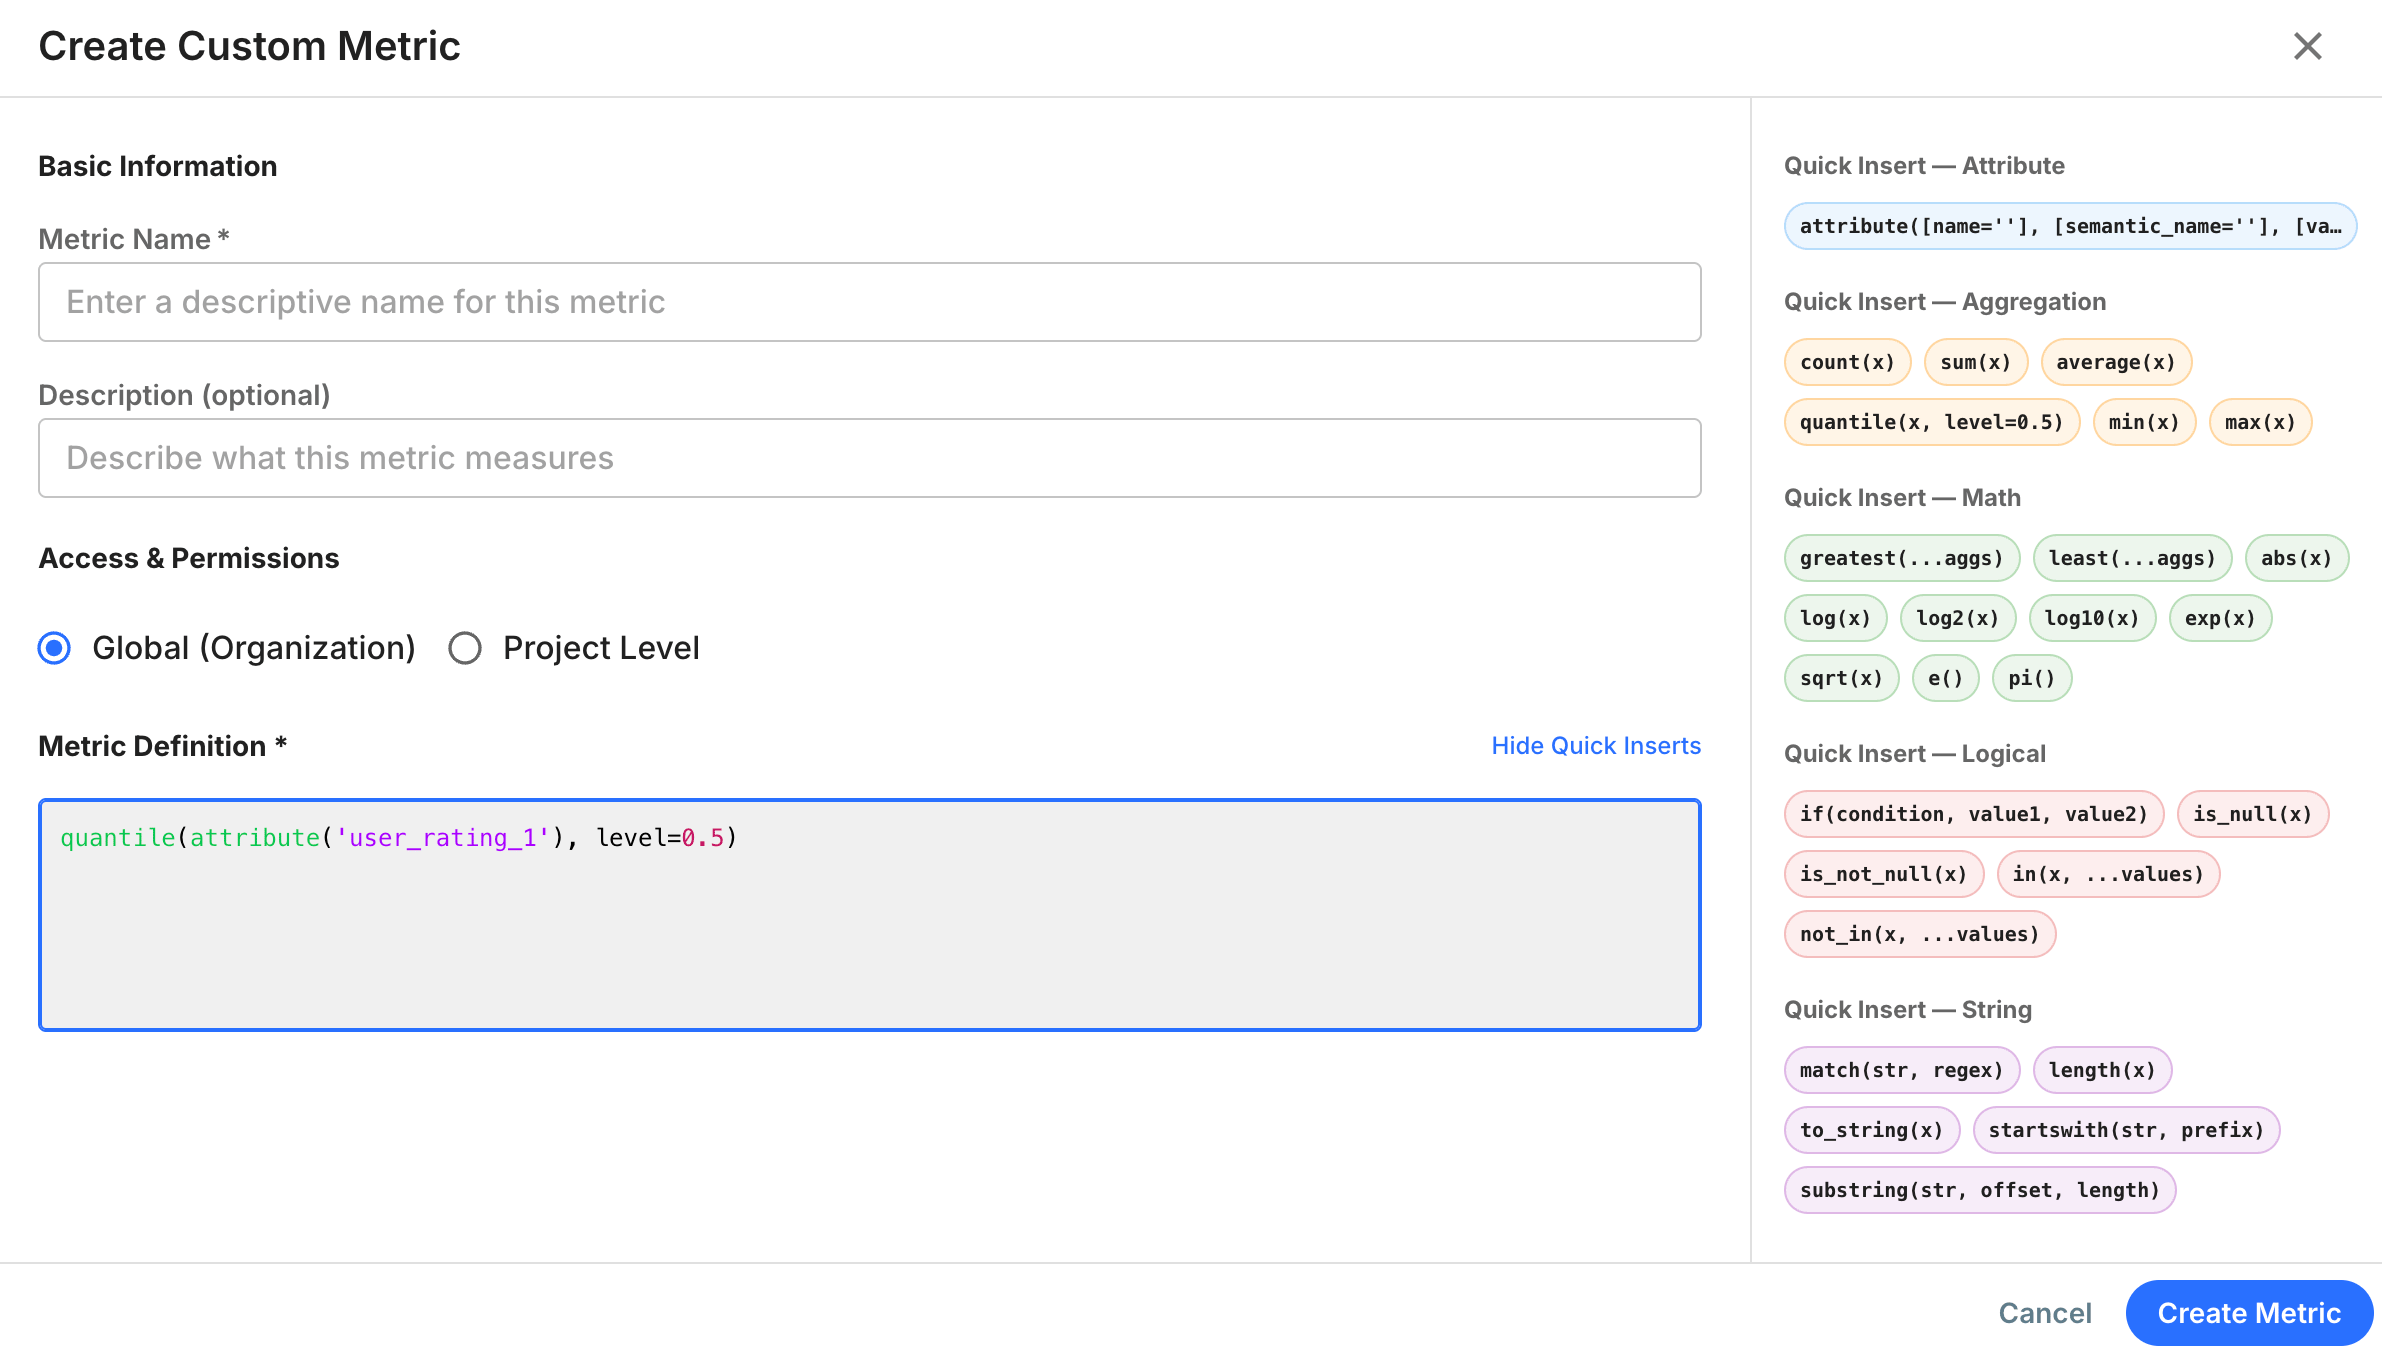
Adding a Custom Metric
- Navigate to the Custom Metrics section in the Fiddler UI.
- Click Add Custom Metric.
- Enter a Metric name, an optional Description, and the Metric definition.
- Optionally select a project to scope the metric to. If no project is selected, the metric is created as an organization-level metric visible across all projects.
- Click Create Metric.
Using Custom Metrics in Charts
After saving a custom metric, you can use it in chart definitions:- Open or create a chart in the Fiddler UI.
- Set Metric Type to Custom Metric.
- Select your custom metric from the list.
Deleting Custom Metrics
To delete a custom metric, click the trash icon next to the metric in the Custom Metrics tab. Deletion runs as a background job that automatically:- Removes the metric from any charts that reference it
- Deletes charts that have no remaining metrics after cleanup
- Updates dashboard layouts to remove deleted charts
- Deletes dashboards that become empty as a result
Examples
Custom metrics must return either an aggregate (produced by aggregate functions) or a combination of aggregates. See the FQL reference for the full list of supported operators and functions.Average input token usage
Track the mean number of input tokens consumed per span to monitor LLM cost drivers over time. Because this references a semantic concept, the same metric works whether your traces come from OpenInference, the Vercel AI SDK, LiteLLM, or any other supported framework.Number (e.g., 312.4)
Premium user ratio
Measure the fraction of spans attributed to premium-tier users by filtering on a categorical attribute.Number between 0 and 1 (e.g., 0.34)
P95 total token usage
Use thequantile() function to track the 95th-percentile of a per-span value. A percentile gives a stable high-end bound, unlike an average that a few extreme spans can distort.
Number representing the 95th-percentile total tokens per span (e.g., 2048)
To track a latency value your own instrumentation emits, reference it by its verbatim key — for example, quantile(attribute('response_time_ms'), level=0.95) — where the returned value is in whatever unit your application sends.
Conditional cost (weighted by outcome)
Apply different weights to successful and failed spans to surface the true cost impact of errors. Theif(condition, true_value, false_value) function evaluates the condition per span and returns one of two values.
Number (e.g., 0.0042)
Token usage range
Track the spread of a per-span value across a time window. A widening range can point to inconsistent request sizes or a few unusually large requests — here, the gap between the largest and smallest total token counts.Number representing the spread between the largest and smallest total token counts (e.g., 3072)
Minimum token usage
Find the smallest input token count across all spans in a window. Useful for detecting unusually short requests that may indicate truncated inputs or misconfigured clients. Reference the attribute by its verbatim key, which matches only the frameworks that emit that exact key:Number (e.g., 12)
Null-safe cost with markup
Apply a price adjustment to spans that have a cost attribute, while preservingnull for spans where cost data is absent — avoiding accidental zero-inflation of the average.
Number representing the average marked-up cost, excluding null-cost spans (e.g., 0.0048)
Use
is_null() to test whether an attribute is absent. The null keyword is for use as a return value in expressions (e.g., if(condition, value, null)) to propagate missing data explicitly.Related Resources
- Fiddler Query Language (FQL) — full reference for operators, aggregate functions, and expression syntax
- Custom Metrics for ML Models — custom metrics using model schema columns instead of span attributes
- Agentic Observability — overview of dashboards, metrics, and integrations for agentic applications
- Custom Metrics glossary entry
- Data Retention Policy — includes planned support for retaining a chart’s history in Mission Control beyond raw trace retention