Overview
Custom metrics offer the capability to define metrics that align precisely with your machine learning requirements. Whether it’s tracking business KPIs, crafting specialized performance assessments, or computing weighted averages, custom metrics empower you to tailor measurements to your specific needs. Seamlessly integrate these custom metrics throughout Fiddler, leveraging them in dashboards, alerting, and performance tracking. Create user-defined metrics by employing a simple query language we call Fiddler Query Language (FQL). FQL enables you to leverage your model’s features, metadata, predictions, and outcomes for new data fields using a rich array of aggregations, operators, and metric functions, thereby expanding the depth of your analytical insights.How to Define a Custom Metric
Build custom metrics effortlessly with Fiddler’s intuitive Excel-formula-like syntax. Once a custom metric is defined, Fiddler distinguishes itself by seamlessly managing time granularity and ranges within the charting, dashboarding, and analytics experience. This empowers you to effortlessly adjust time range and granularity without the need to modify your query, ensuring a smooth and efficient analytical experience.Adding a Custom Metric
From the model schema page, you can access the model’s custom metrics by clicking the Custom Metrics tab at the top of the page. Then click Add Custom Metric to add a new Custom Metric. Finally, enter the name, description, and FQL definition for your custom metric and click Save.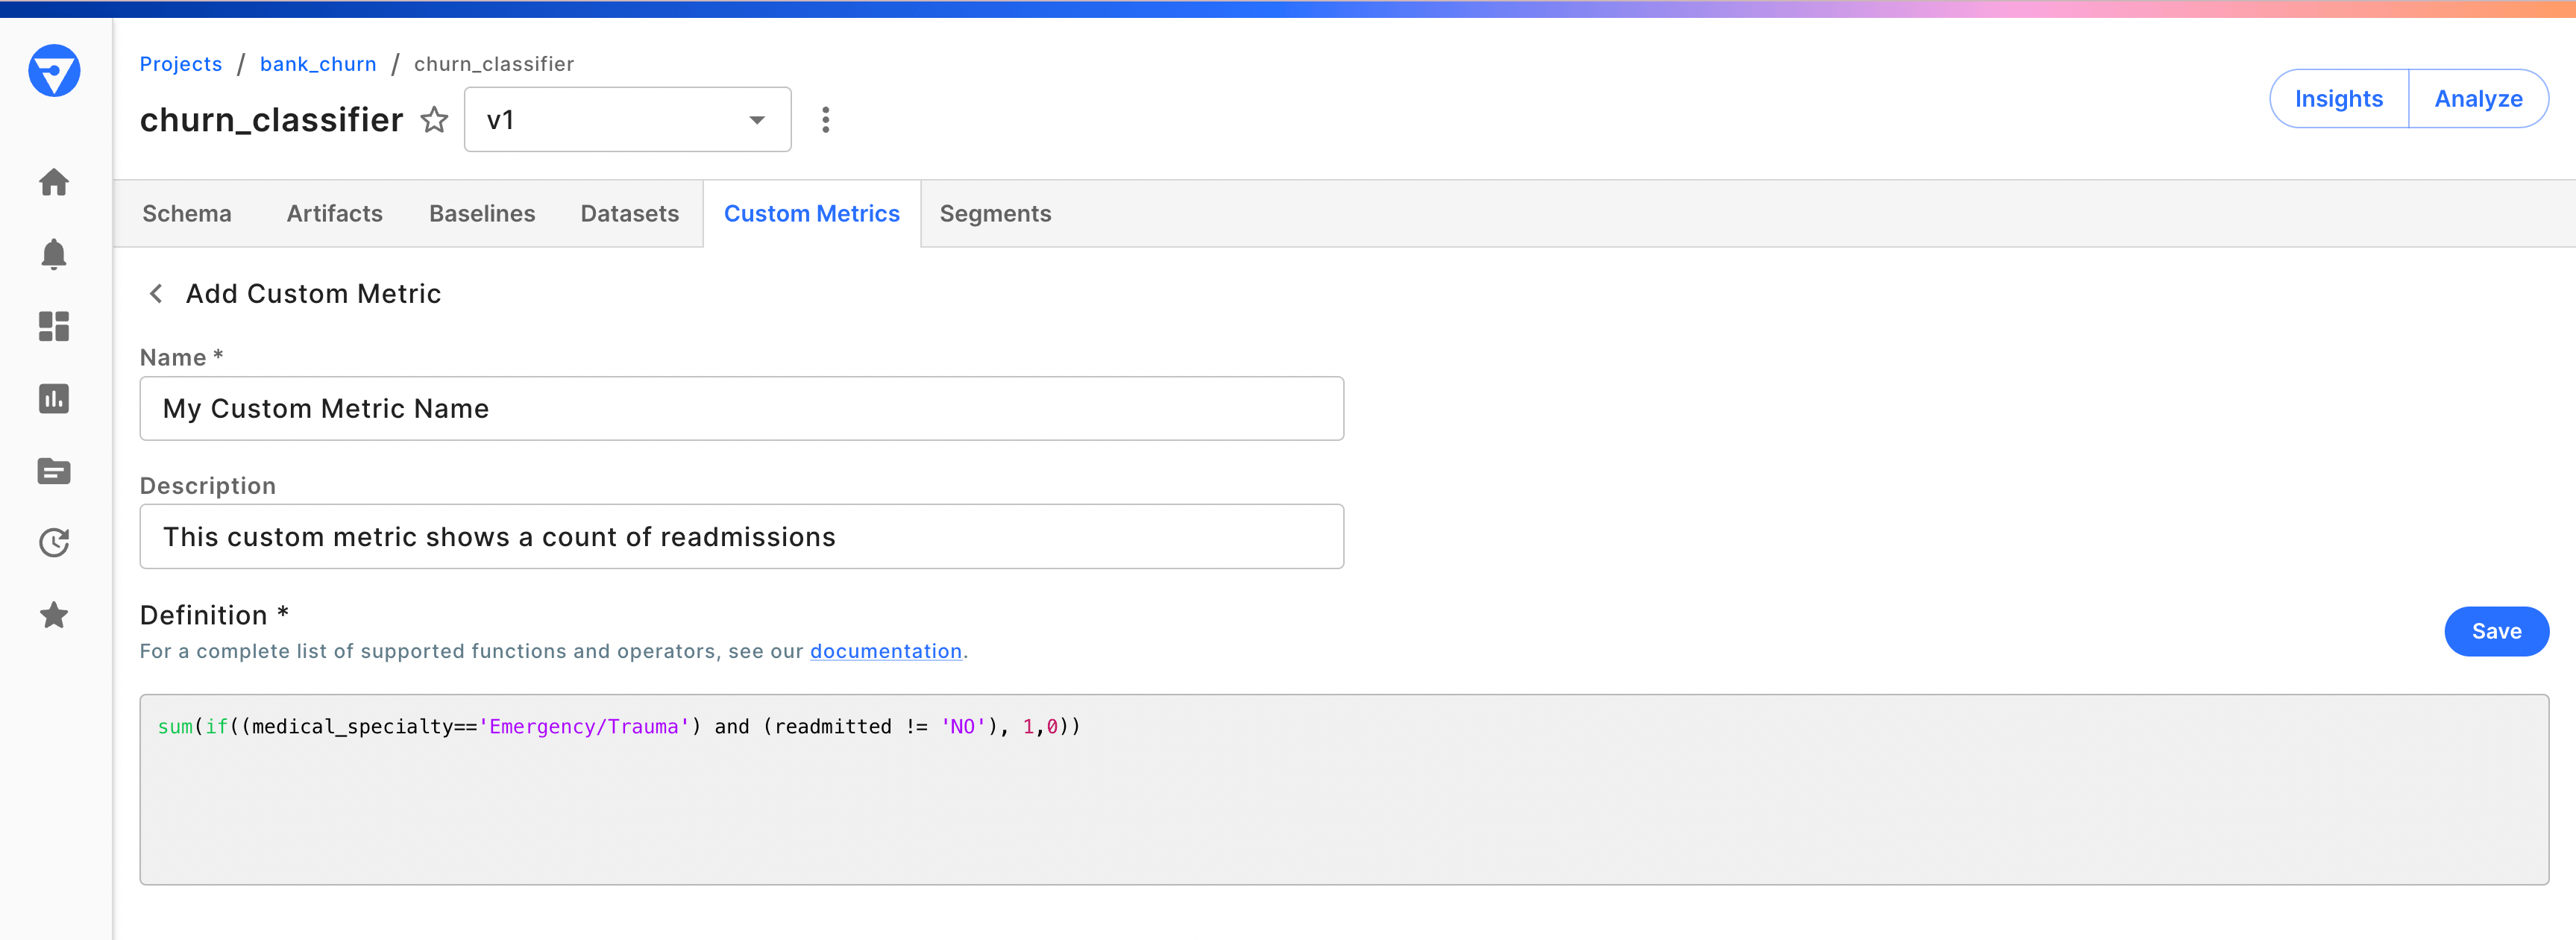
Accessing Custom Metrics in Charts and Alerts
After your custom metric is saved, you can use it in your chart and alert definitions.Charts
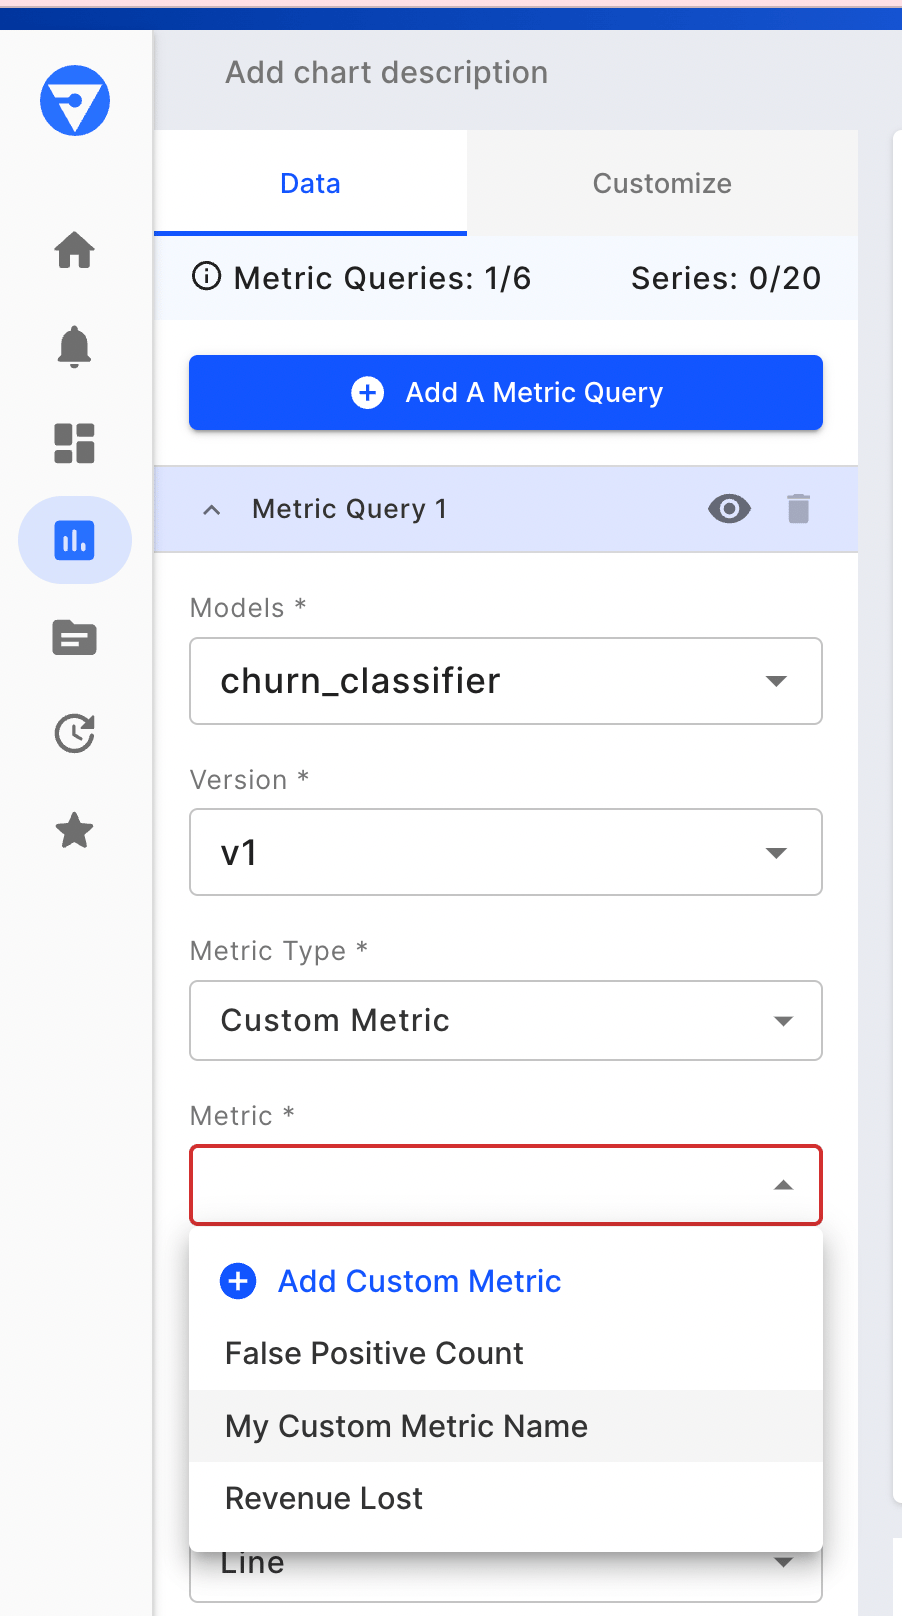
SetMetric Type to Custom Metric and select your desired custom metric.
Alerts
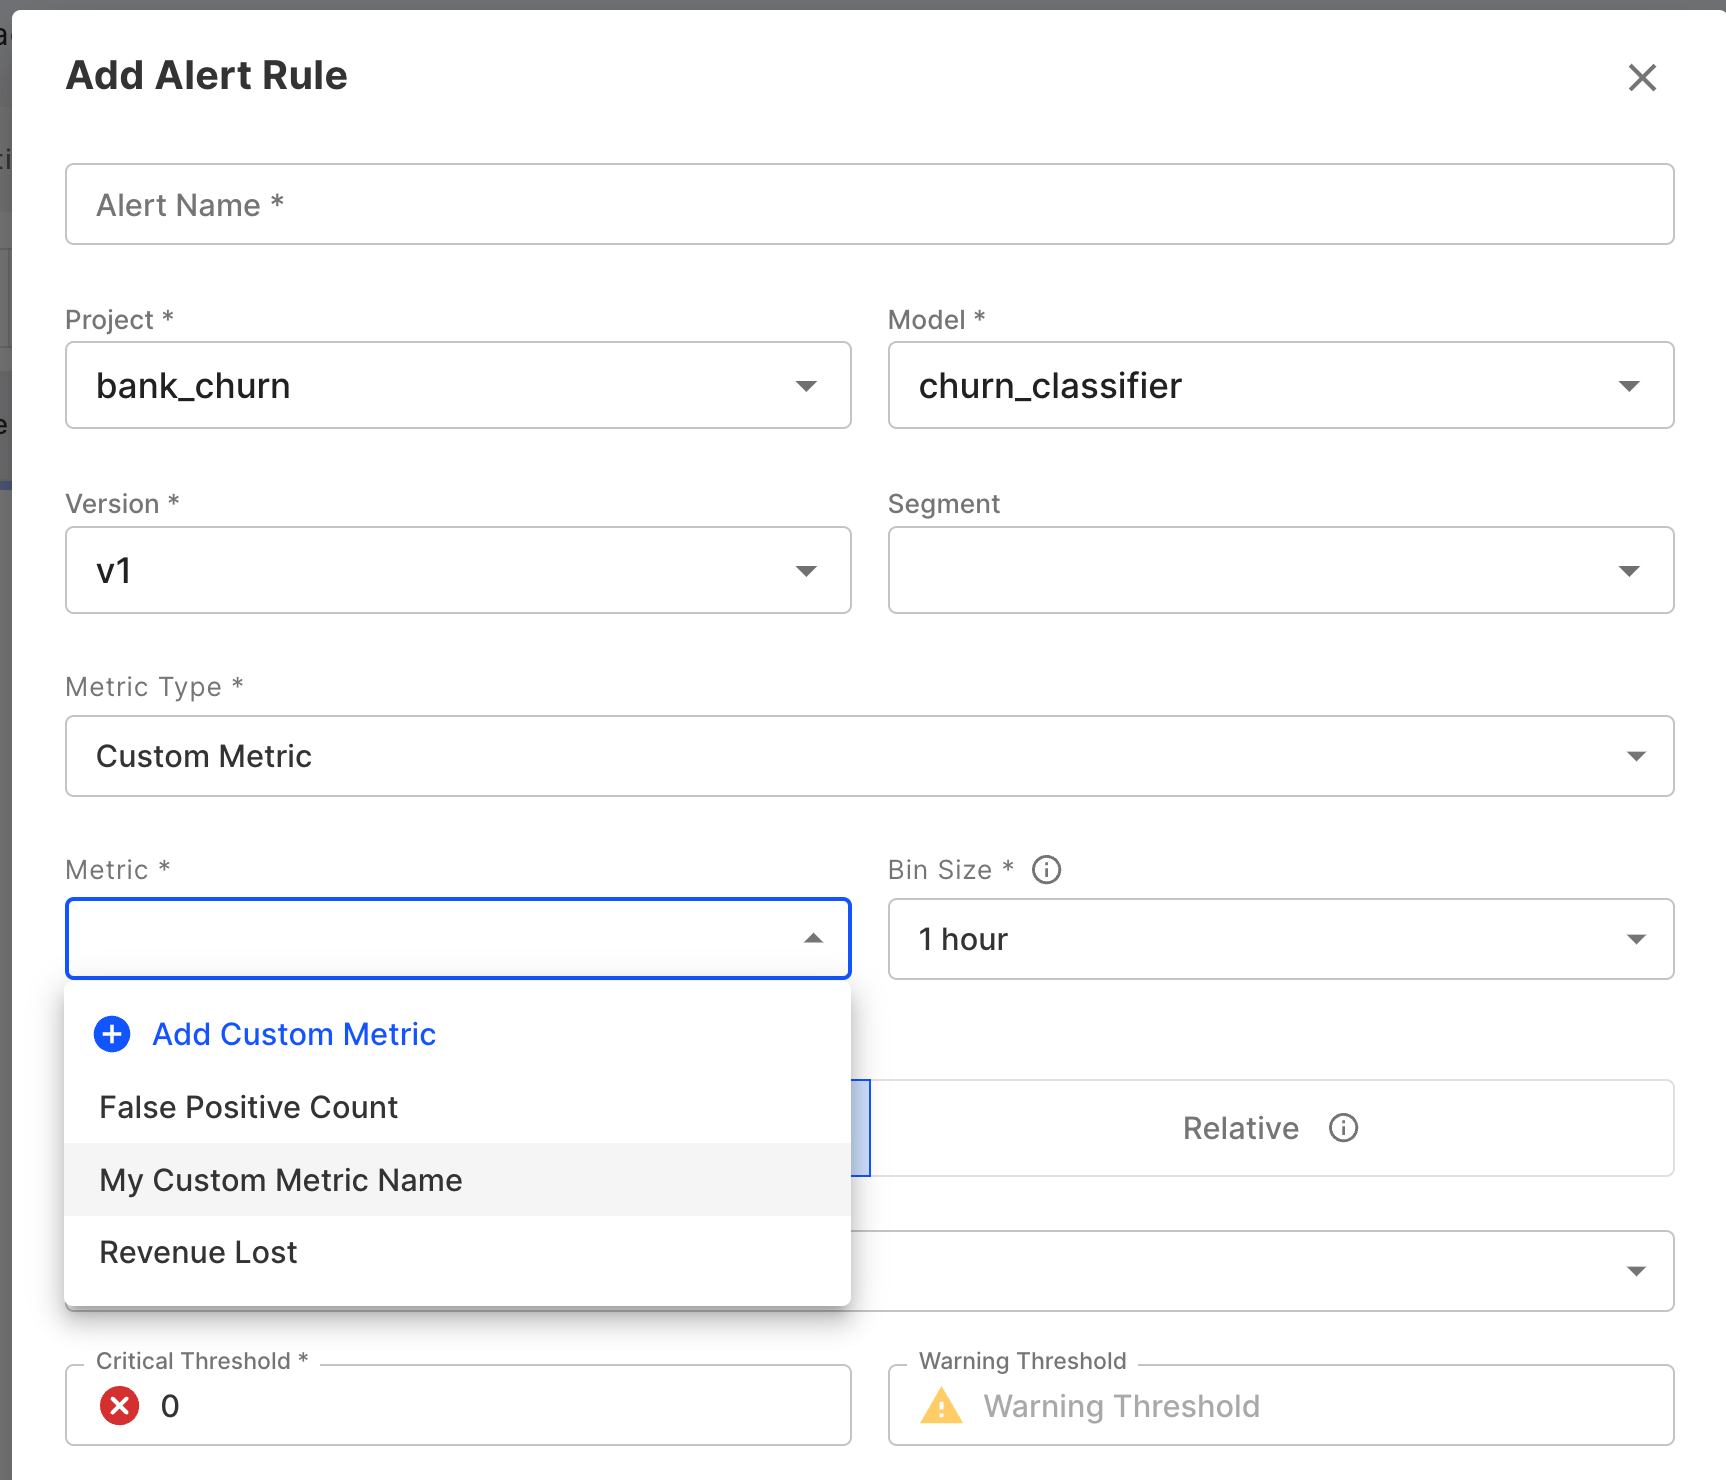
When creating a new alert rule, setMetric Type to Custom Metric, and under the Metric field select your desired custom metric or author a new metric to use.
Modifying Custom Metrics
Since alerts can be set on Custom Metrics, making modifications to a metric may introduce inconsistencies in alerts.🚧 Therefore, custom metrics cannot be modified once they are created.If you’d like to try out a new metric, you can create a new one with a different name and definition.
Deleting Custom Metrics
To delete a custom metric using the Python client, see CustomMetric.delete(). Alternatively, from the custom metrics tab, you can delete a metric by clicking the trash icon next to the metric record.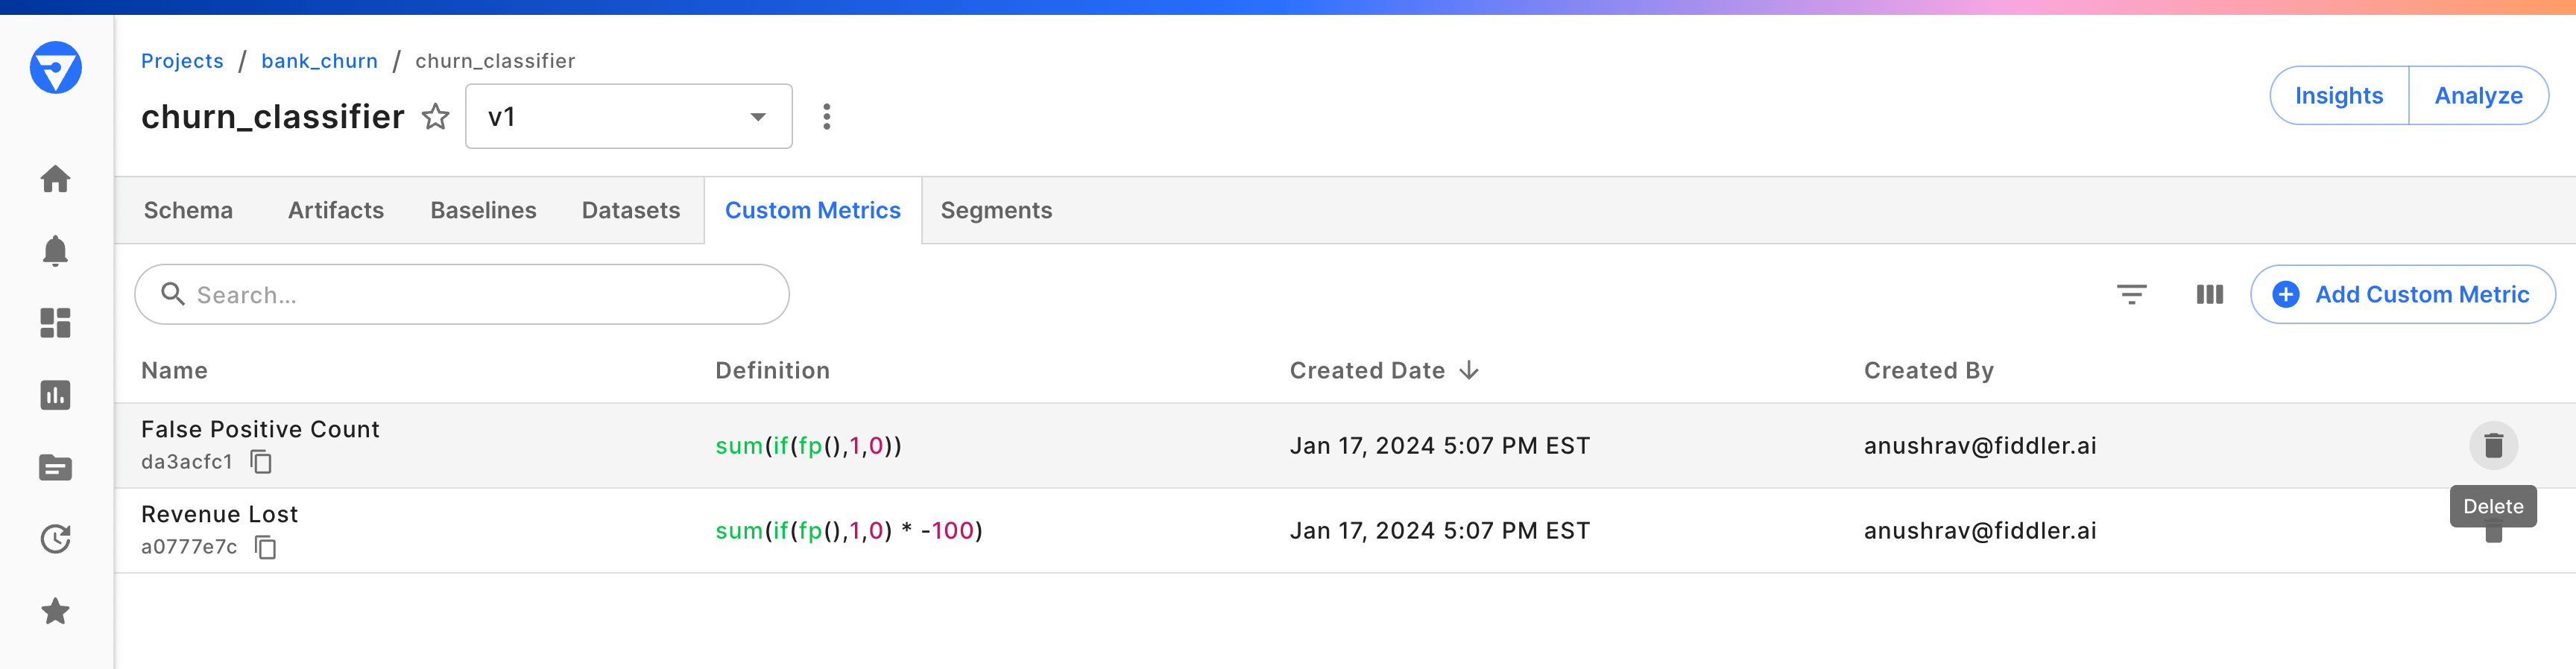
Examples
📘 Custom metrics must return either:
- an aggregate (produced by aggregate functions or built-in metric functions)
- a combination of aggregates
Simple Metric
Given this example use case:If an event is a false negative, assign a value of -40. If the event is a false positive, assign a value of -400. If the event is a true positive or true negative, then assign a value of 250.Create a new Custom Metric with the following FQL formula:
fp() and fn().
Alternatively, we could also identify false positives and false negatives the old fashioned way.
Prediction is the name of the output column for a binary classifier and Target is the name of our label column.
Tweedie Loss
In our next example, we provide an example implementation of the Tweedie Loss Function. Here,Target is the name of the target column and Prediction is the name of the prediction/output column.
Quantile/Percentile Metrics
Quantile metrics are essential for understanding the distribution of your data and tracking percentile-based performance indicators. Unlike averages, which can be skewed by outliers, quantiles provide robust insights into the actual behavior of your model across different percentiles. Use Case: Monitoring ML Model Latency Track the median (50th percentile) inference time to understand typical model performance:📘 Why use quantiles instead of averages? Quantiles provide a more complete picture of your data’s distribution. While averages can be heavily influenced by outliers, percentiles show you the actual values at specific points in your distribution. For example, a 95th percentile latency of 500ms means 95% of your requests complete in 500ms or less, regardless of how slow the remaining 5% might be.
Gini Coefficient
The Gini coefficient, derived from the Lorenz curve, measures how well a model’s predicted scores rank actual values. It is available for all ML model task types, including regression. Higher values indicate better ranking ability (the normalized Gini coefficient yields 1 for a perfect model and 0 for a random model).gini() is available for ML custom metrics only. It is not supported for GenAI or agentic applications.actual and predicted are required keyword arguments of type Number. Column names must match your model schema exactly (case-sensitive).
Use case: Basic Gini coefficient
gini() function returns the raw Gini coefficient. To obtain the normalized version — scaled so a perfect model yields 1 — divide by the ideal Gini where actuals are perfectly ranked by themselves:
'yes'/'no'), use an if expression to convert to numeric 0/1 before passing to gini():
2 * AUC - 1. You can use the built-in auroc() function to compute this directly without needing a separate actual column:
Min and Max
Usemin() and max() to compute the minimum or maximum value of a column or expression across all rows in a time window.
Use case: Feature range (spread)
Track how wide the distribution of a feature is over time. A growing range may indicate data drift.
min(x) and max(x) aggregate a single expression across rows. To compare multiple already-computed aggregates, use least(...) and greatest(...) instead.Null-Safe Expressions
Use thenull keyword as a return value in conditional expressions to explicitly propagate missing data rather than substituting a placeholder.
Use case: Null-safe transformation
Apply a transformation to a column, but return null for rows where the input is missing instead of coercing a default value.
Prediction is non-null, which is equivalent to average(Prediction) * 100 but makes the null-handling intent explicit.
To test whether a value is null, always use
is_null(x) or is_not_null(x). The null keyword is intended for use as a return value only in the if(condition, value, null) expression.Modifying Custom Metrics
Since alerts can be set on Custom Metrics, modifying a metric may introduce inconsistencies in those alerts.🚧 Therefore, custom metrics cannot be modified once they are created.If you’d like to try out a new metric, you can create a new one with a different name and definition.