Alerts with Fiddler UI
Fiddler allows you to set up alerts for your model. View your alerts by clicking on the Alerts tab in the navigation bar. The Alerts tab presents three views: Triggered Alerts, Alert Rules, and Integrations. Users can set up alerts using both the Fiddler UI and the Fiddler API Client. This page introduces the available alert types, and how to set up and view alerts in the Fiddler UI. For instructions about how to use the Fiddler API client for alert configuration see Alert Configuration with Fiddler Client.
Setting up Alert Rules
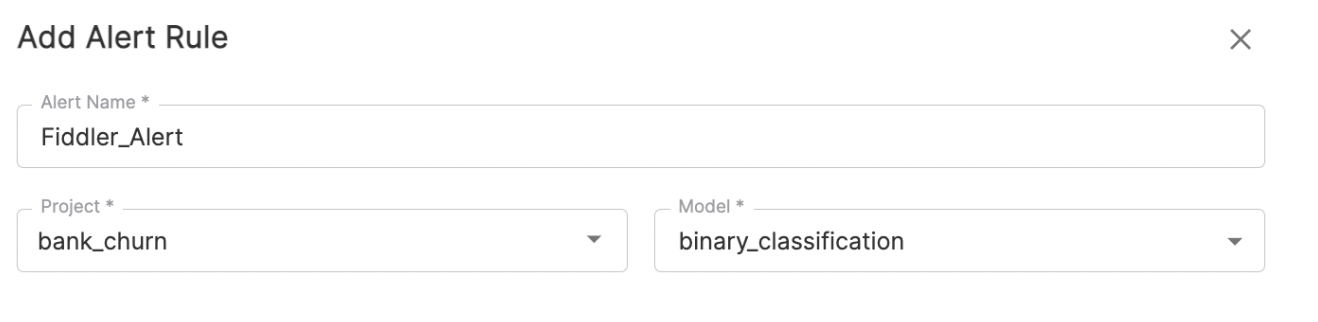
To create a new alert using the Fiddler UI, click the Add Alert button on the top-right corner of any screen on the Alerts tab.
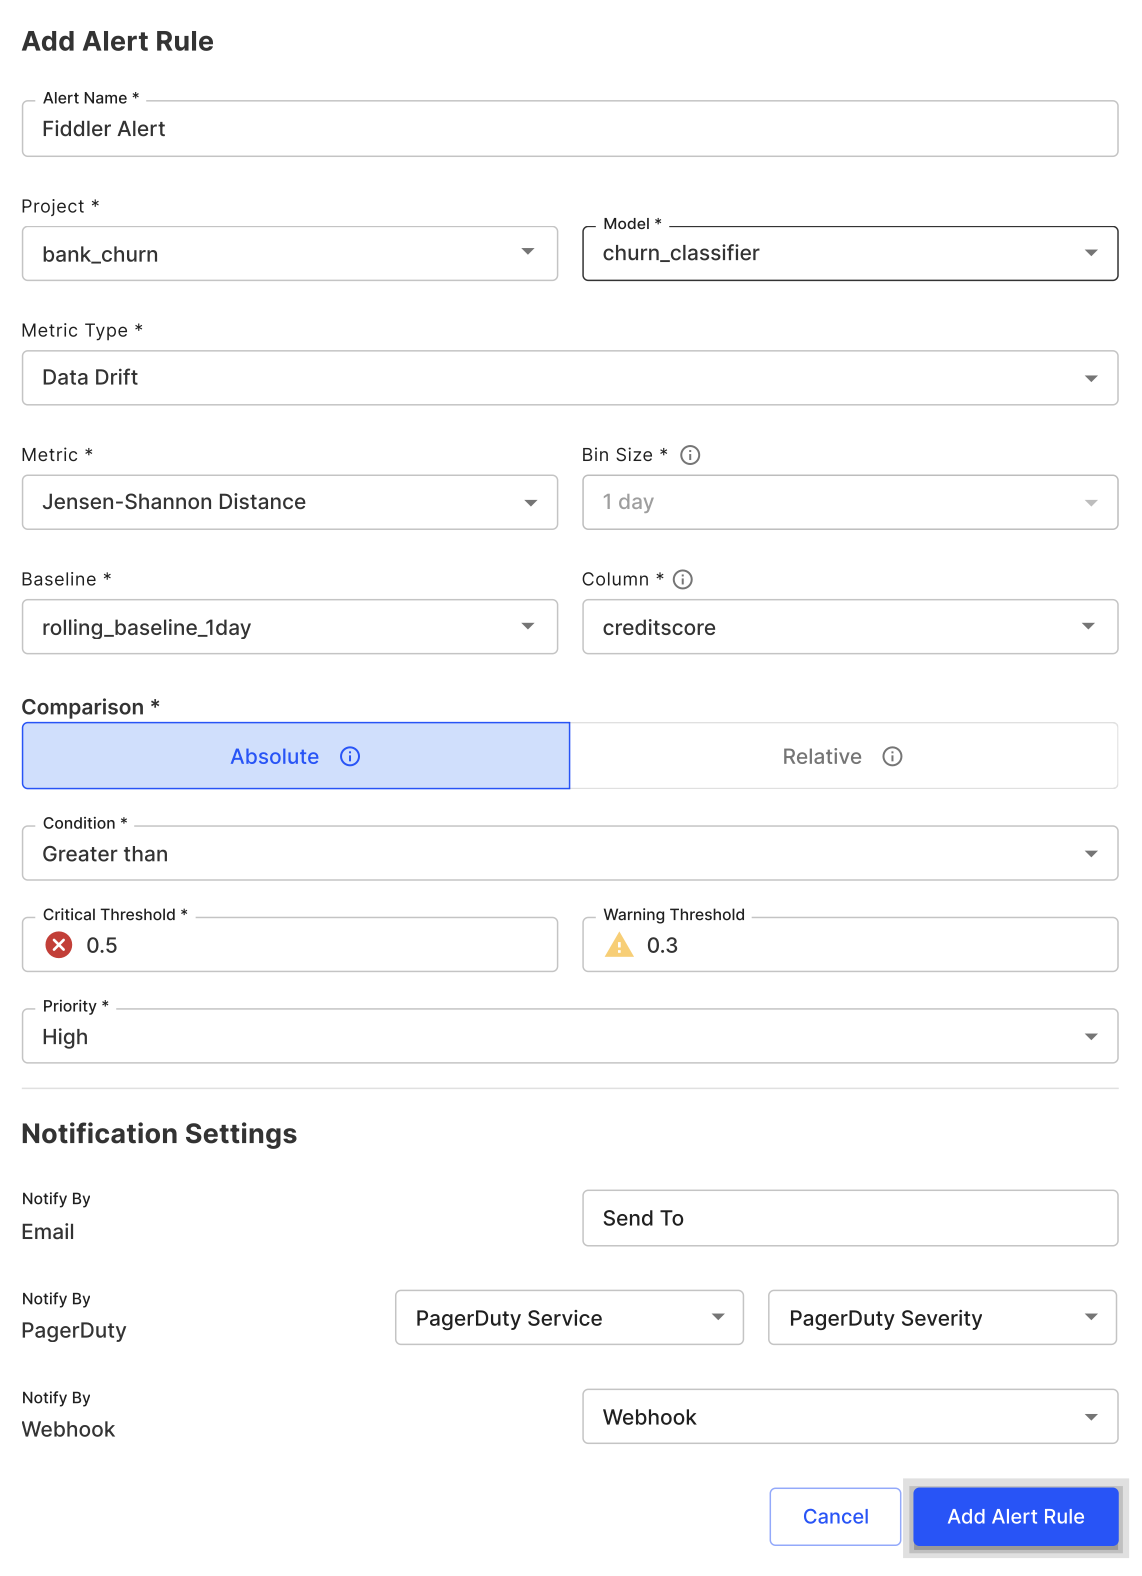
In the Alert Rule form, provide the basic information such as the desired alert name, and the project and model of interest.
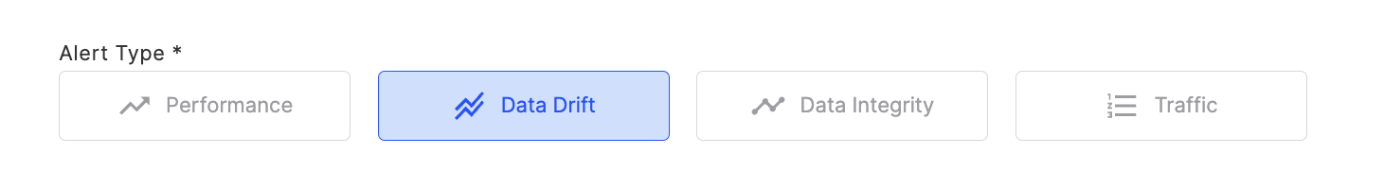
Next, select the Alert Type you would like to monitor. Users can select from Performance, Data Drift, Data Integrity, or Traffic monitors. For this example, we'll set up a Data Drift alert to measure distribution drift.
Once an Alert Type is selected, users can choose a metric corresponding to the Alert Type for which to set the alert on. For our Data Drift alert, we will use JSD (Jensen–Shannon distance) as our metric. The next consideration are the bin size, which is the duration for which fiddler monitoring calculates the metric values, and the column to apply this monitor on. Users can select up to 20 columns from the following column categories; Inputs, Outputs, Targets, Metadata, Decisions, and Custom Features. Let's choose a 1 hour bin and the CreditScore column for this example.
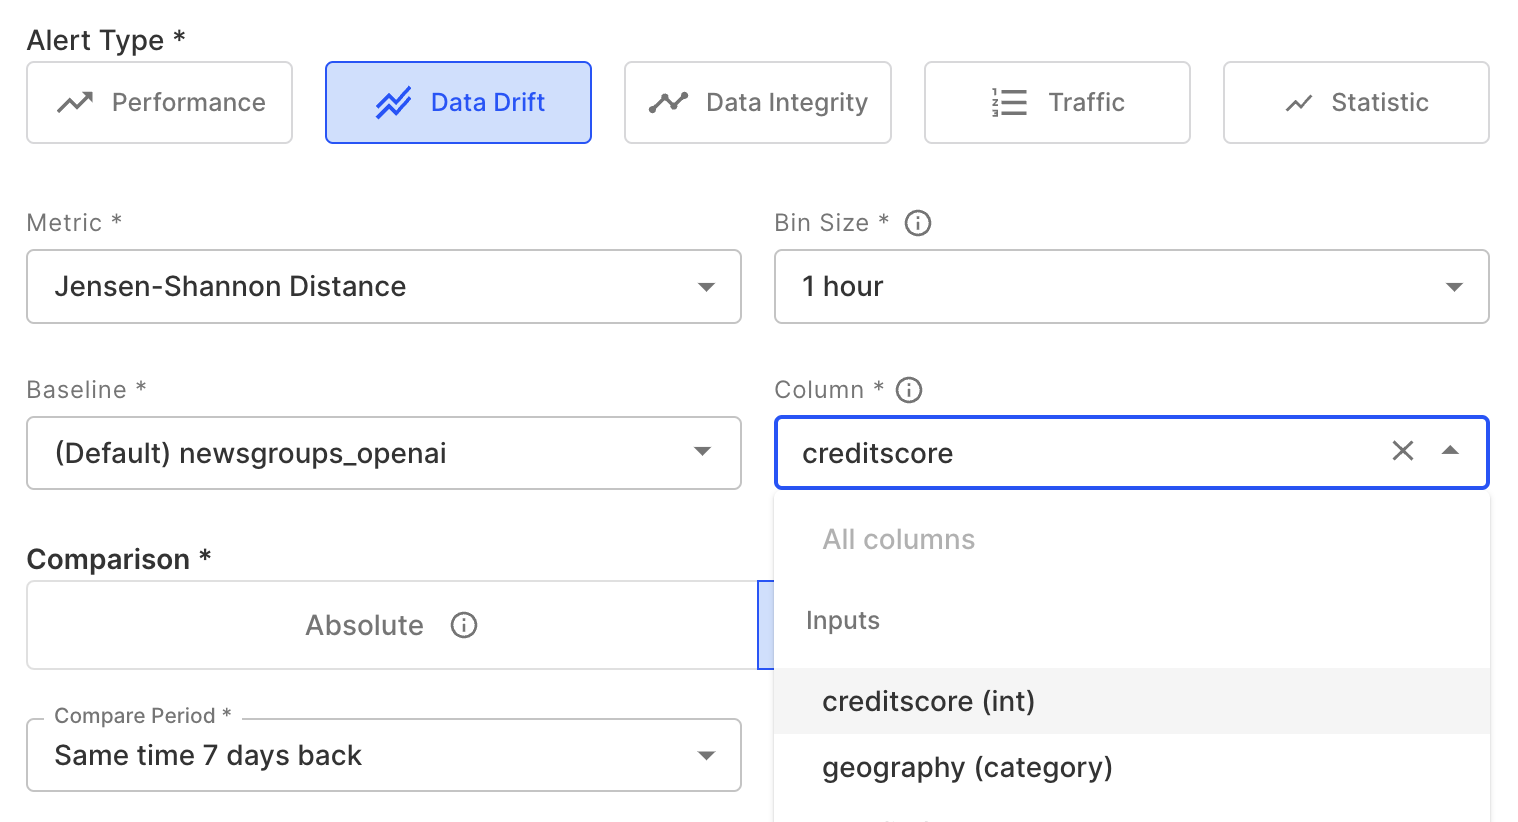
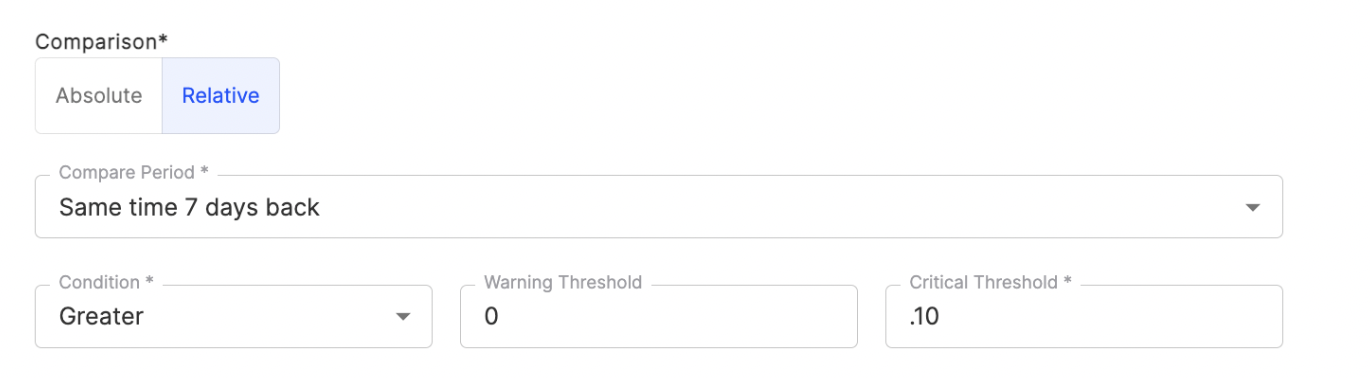
Next, users can focus on the alerts comparison method. Learn more about Alert comparisons on the Alerts Platform Guide. For our example, we will select the Relative comparison option, and compare to the same time 7 days back. Users can select the alert condition as well as a Warning and Critical threshold. We will ask for an alert when the production data is greater than 10%.
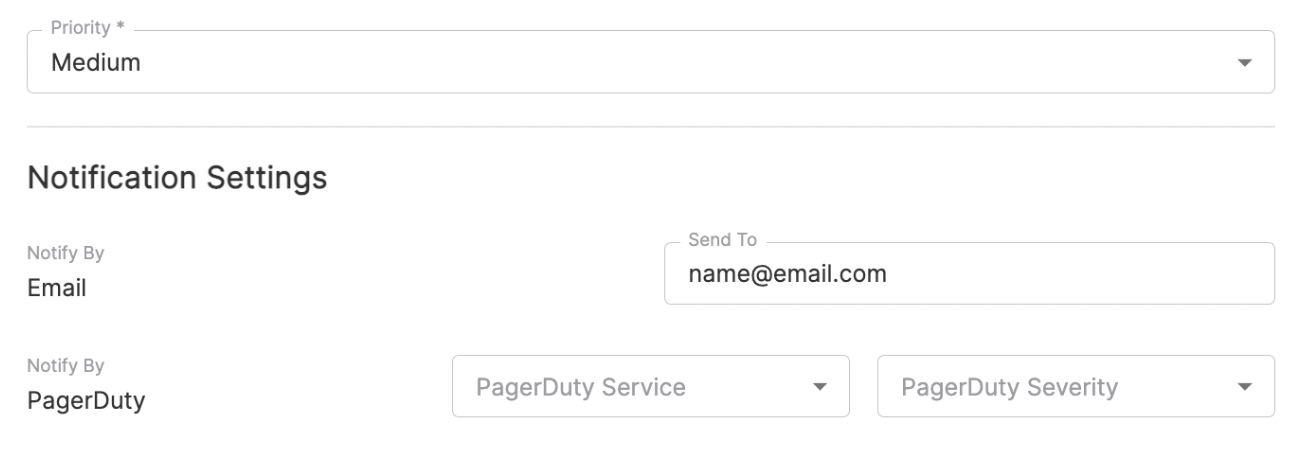
Finally user can set the alert rules priority- how important this alert is to a customers work streams, along with how to get notified of triggered alerts.
Last, click Add Alert Rule when you're done. In order to create and configure alerts using the Fiddler API client see Alert Configuration with Fiddler Client.
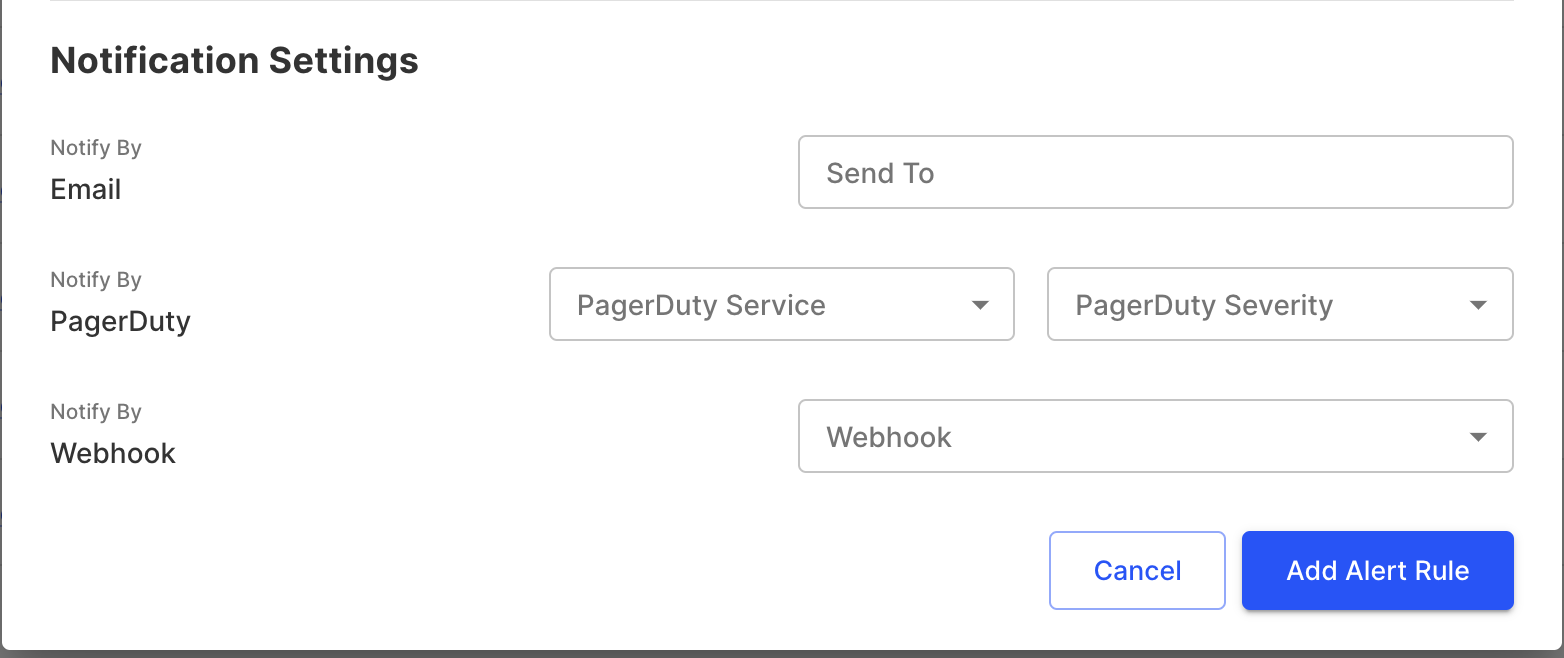
Alert Notification options
You can select the following types of notifications for your alert.
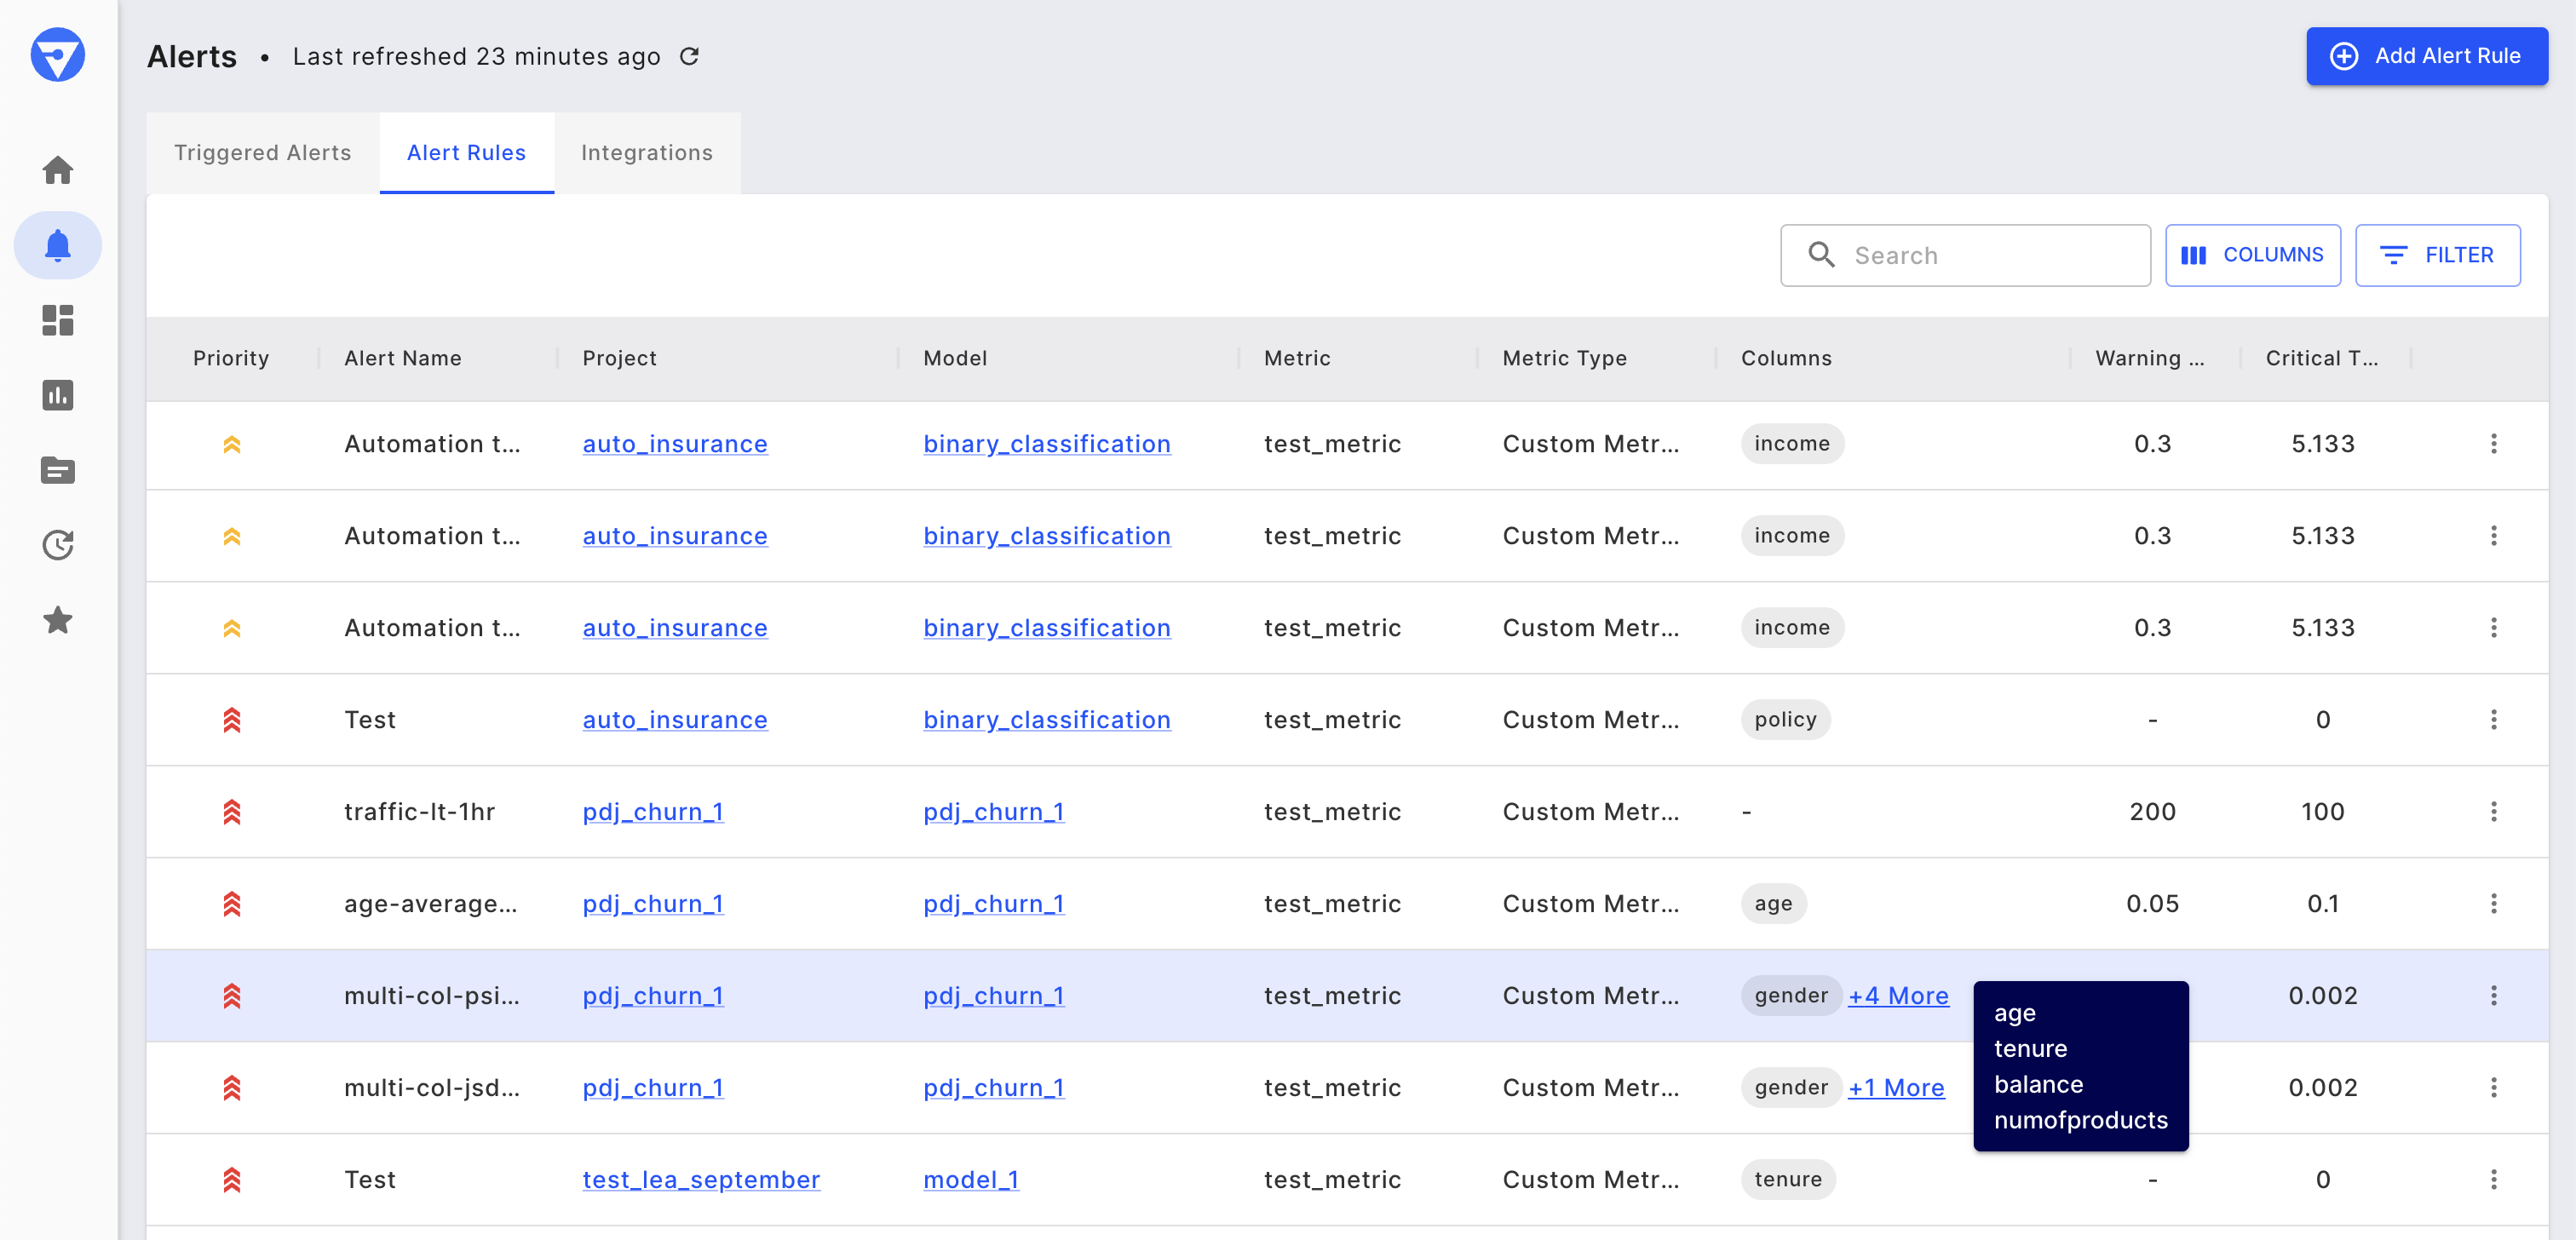
Alert Rules Tab
Once an alert rule is created it can be viewed in the Alert Rules tab. This view enables you to view all alert rules across any project and model at a glance.
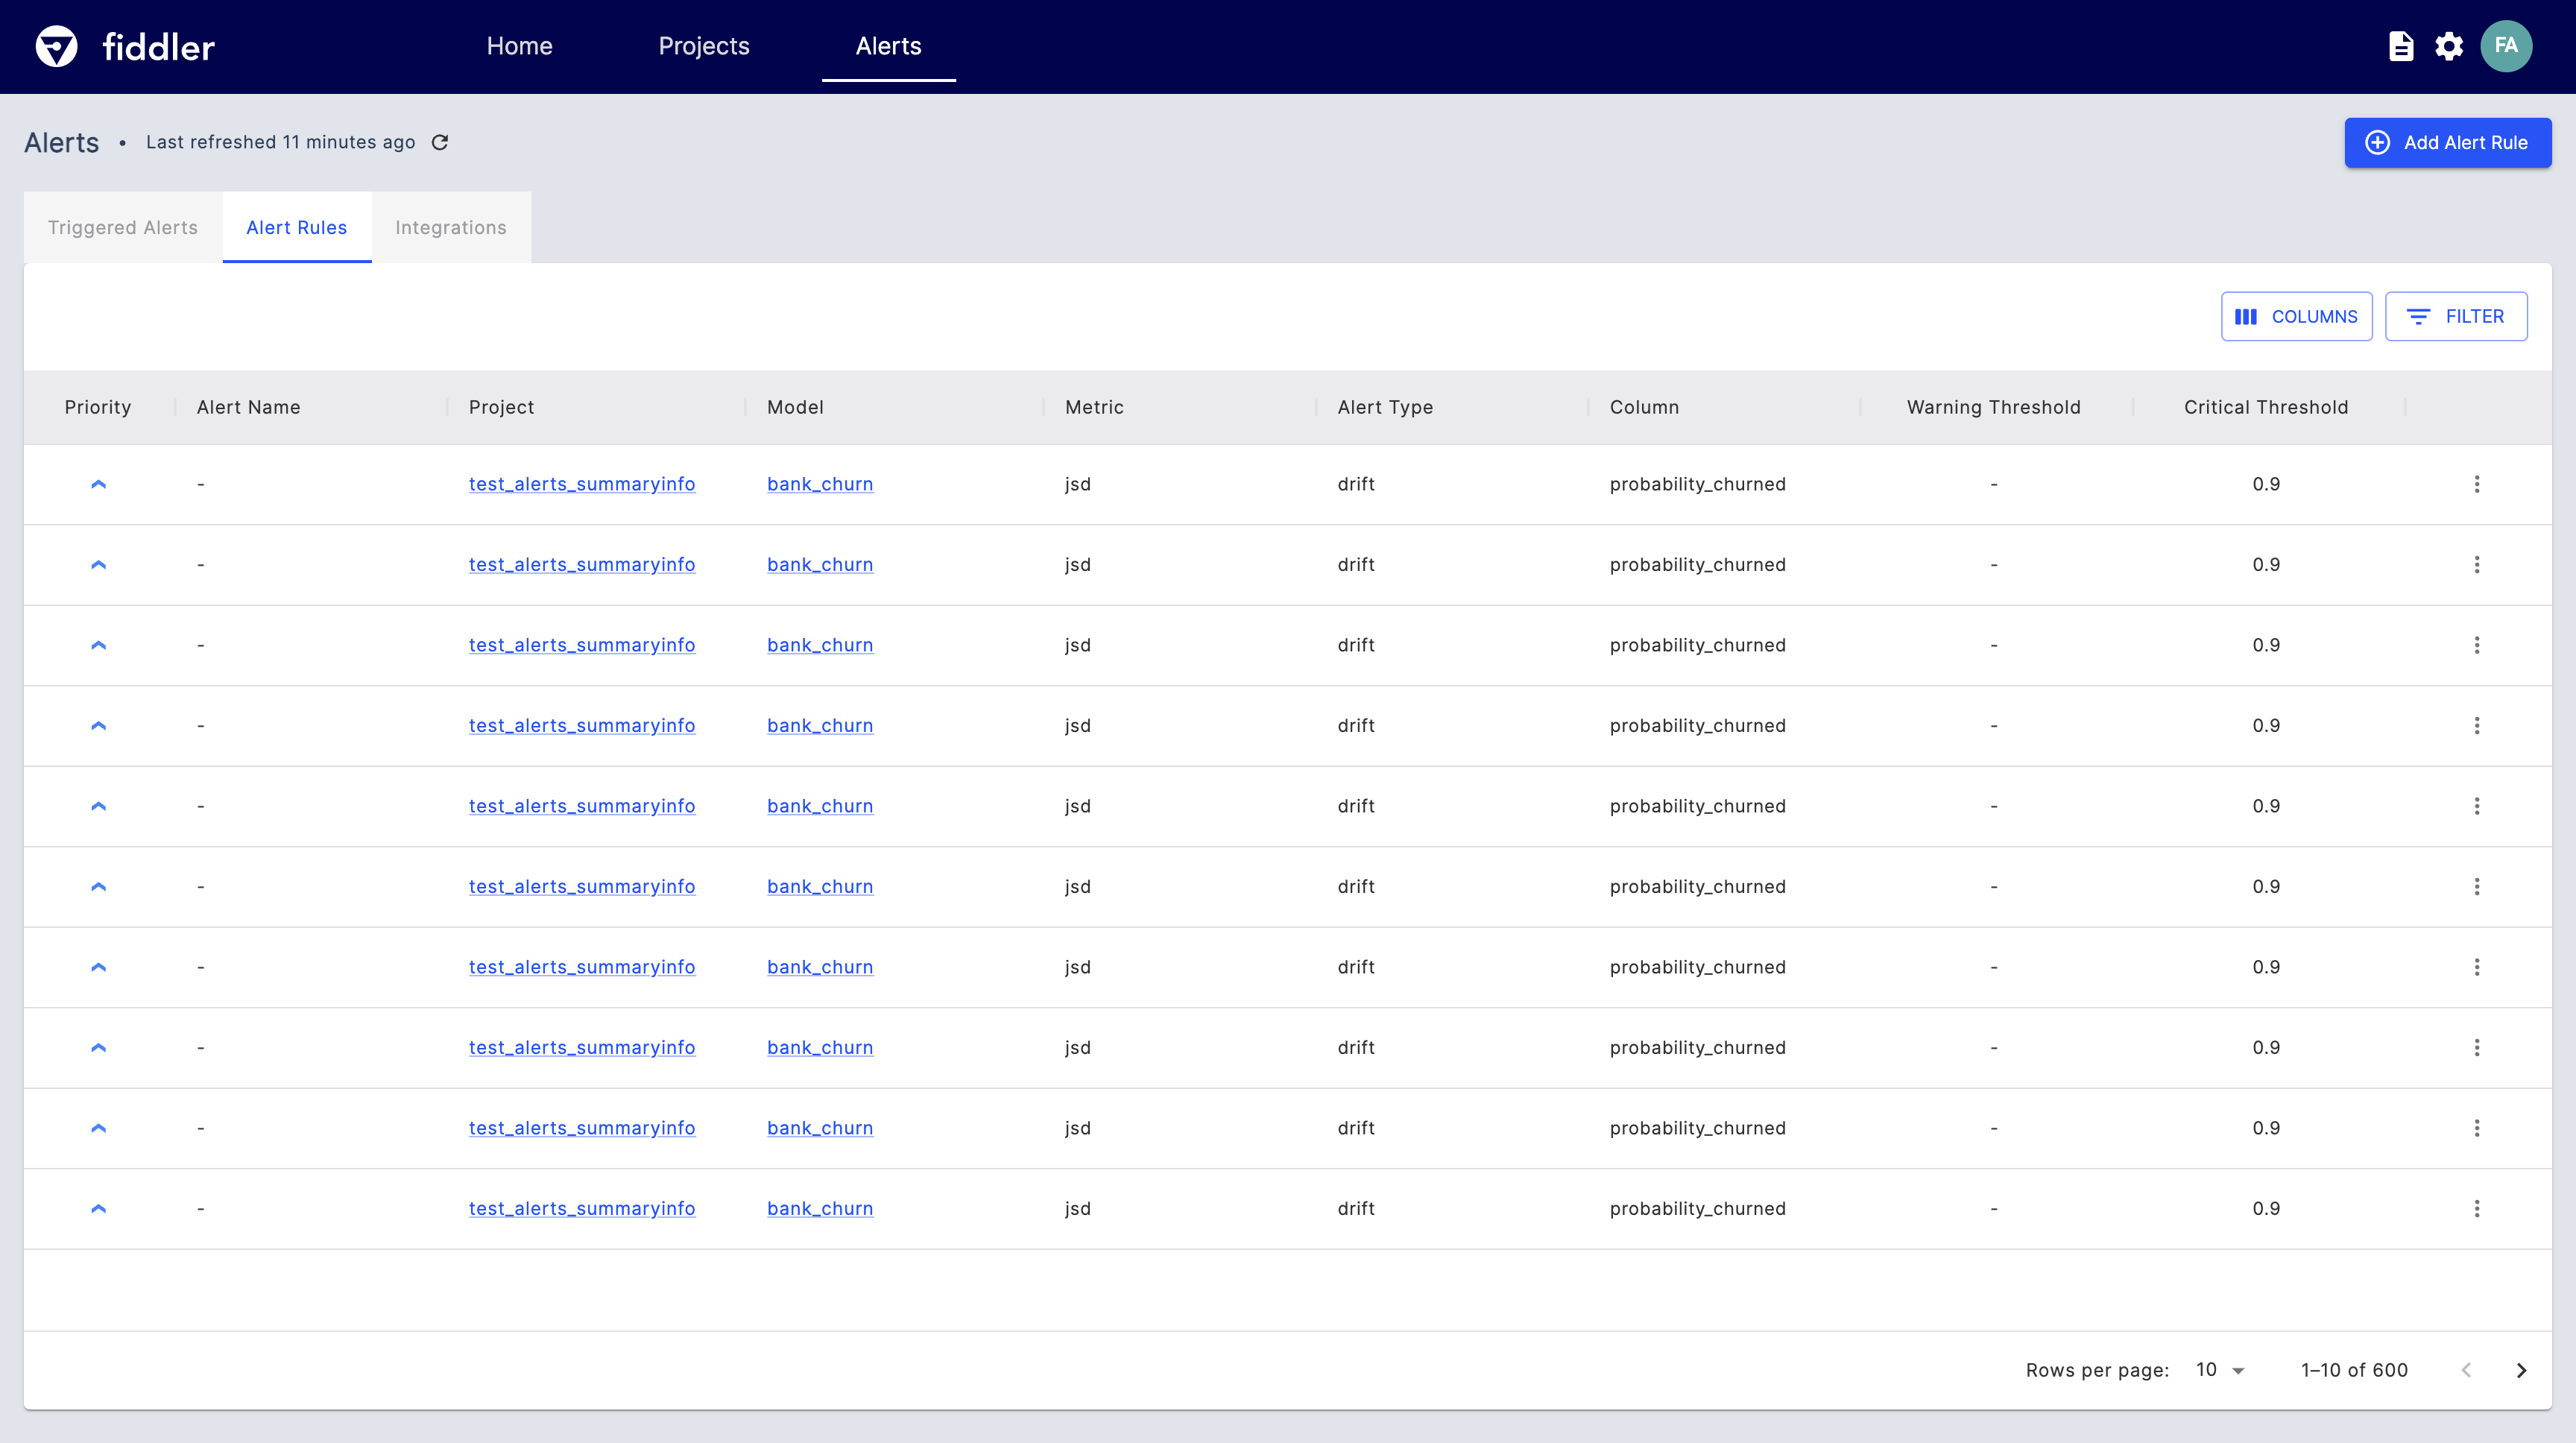
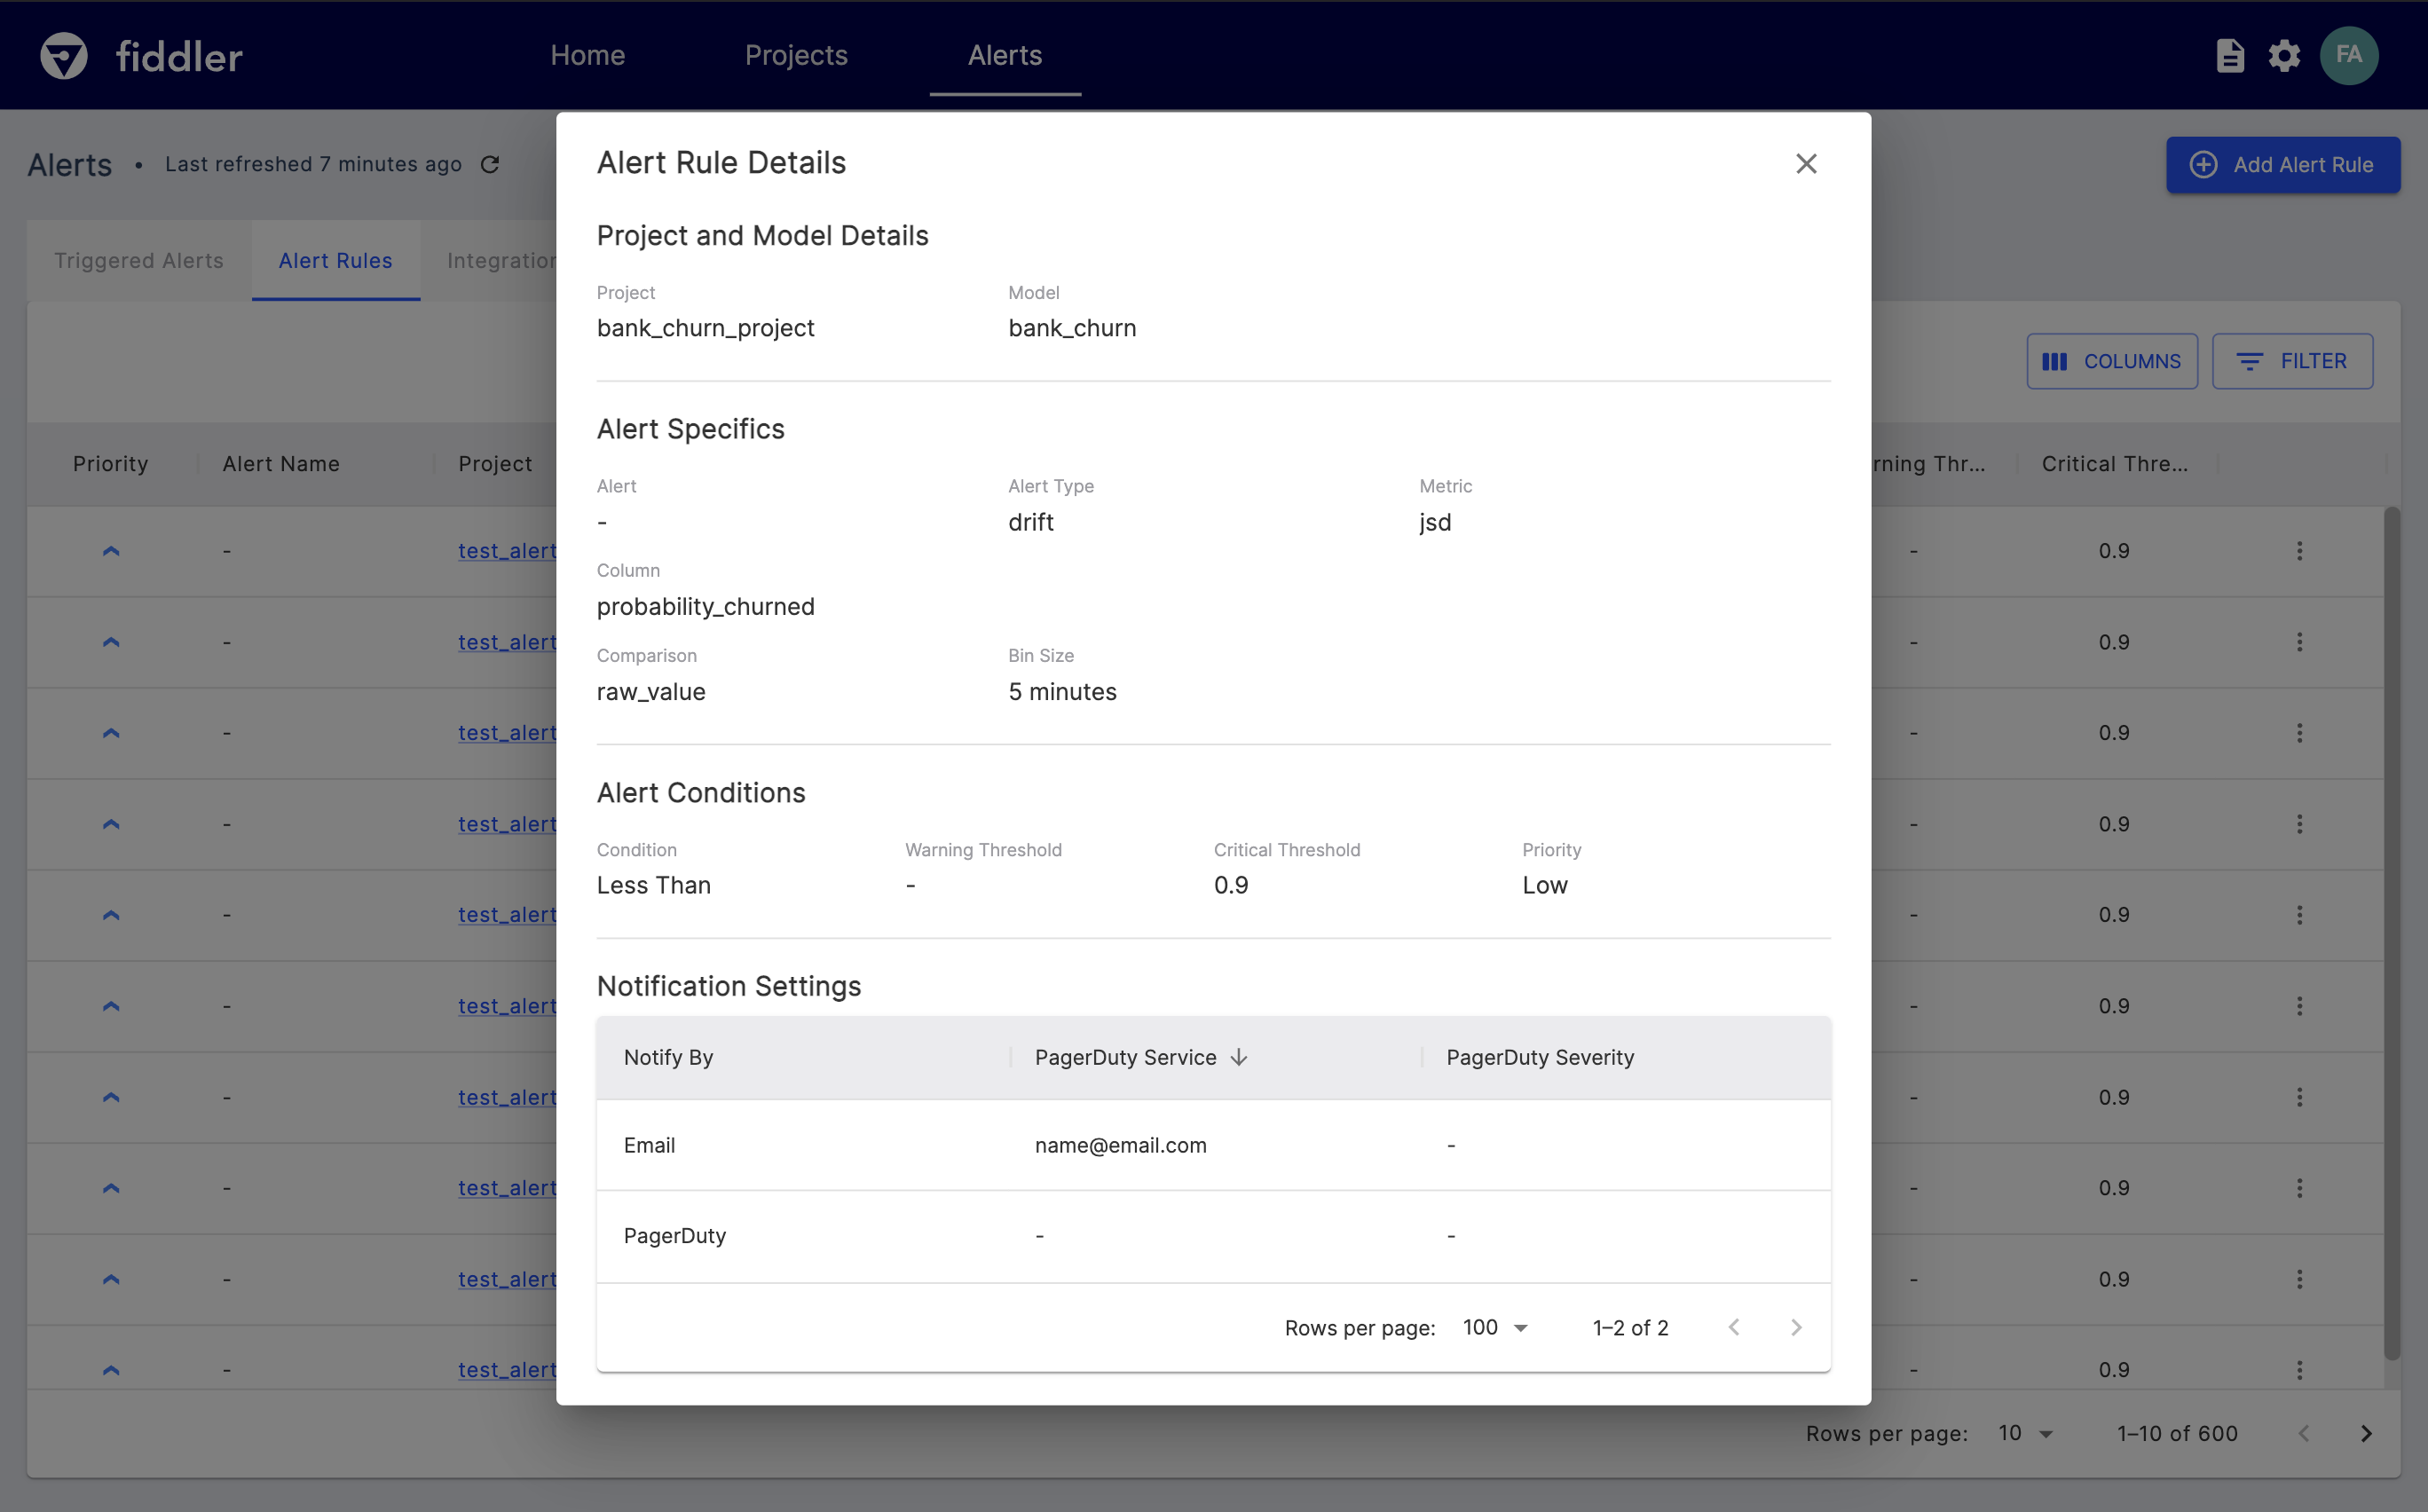
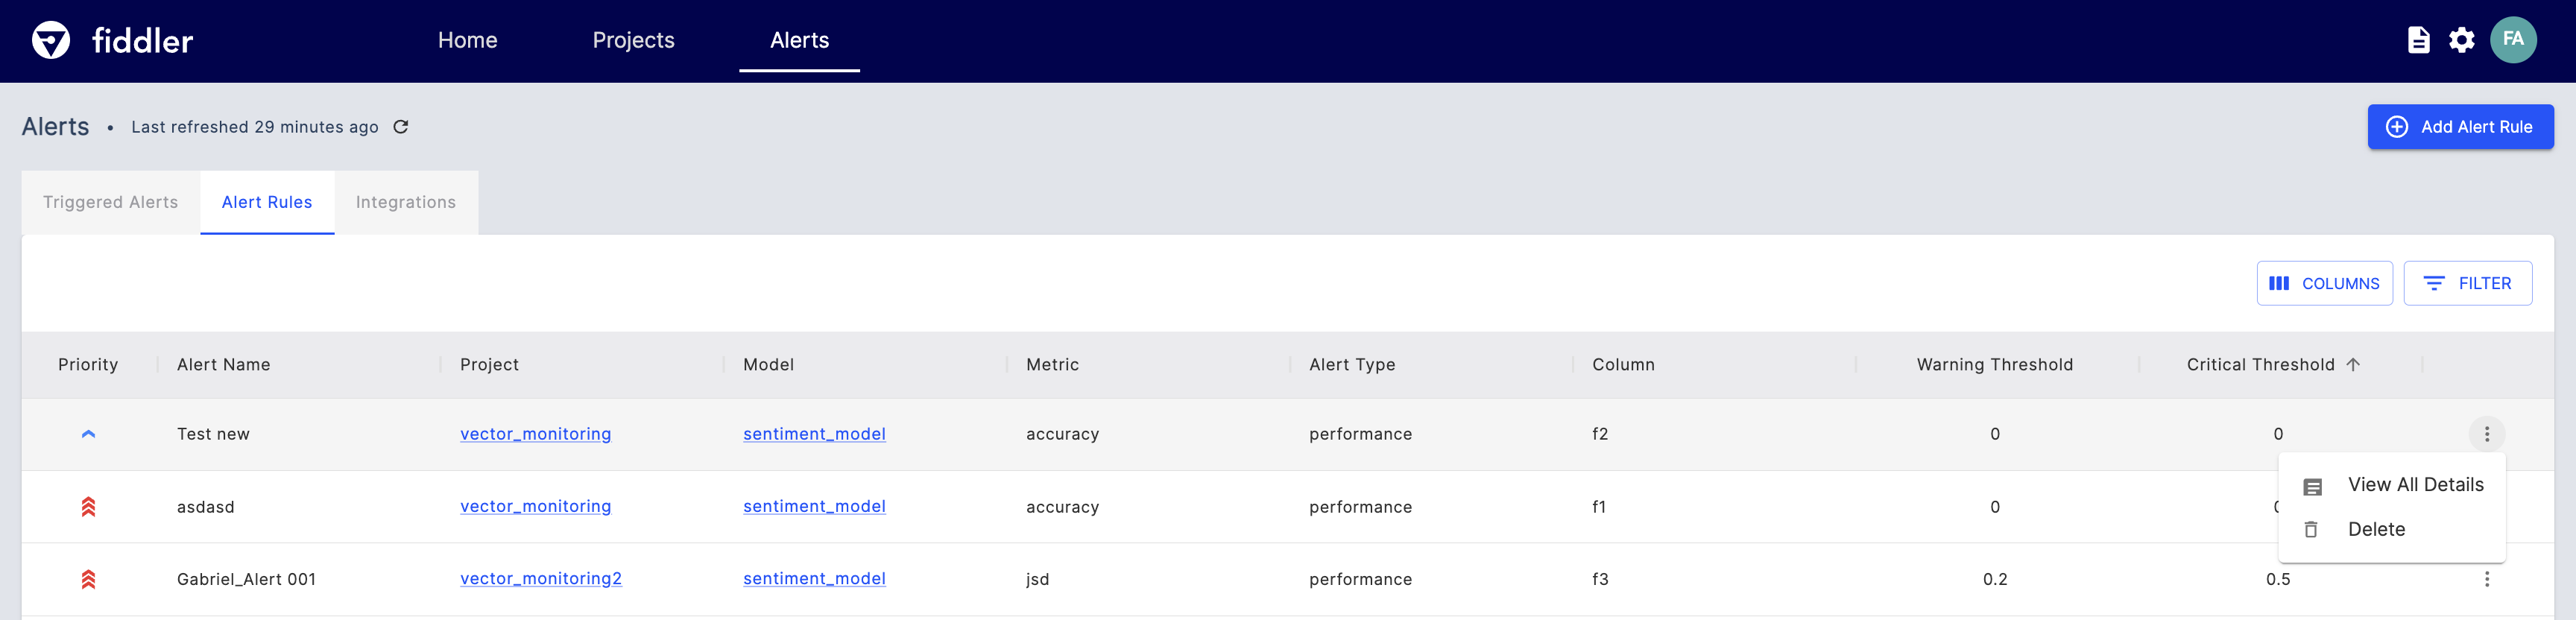
A few high-level details from the alert rule definition are displayed in the table, but users can select to view the full alert definition by selecting the overflow button (⋮) on the right-hand side of any Alert Rule record and clicking View All Details.
Delete an existing alert by clicking on the overflow button (⋮) on the right-hand side of any Alert Rule record and clicking Delete. To make any other changes to an Alert Rule, you will need to delete the alert and create a new one with the desired specifications.
Multi-column alerts
If you have configured multi-column alerts using the Fiddler client, then the columns on which the alert is set will be visible in the "Alert rules" tab
Visualizations
Throughout the Alert Rules, Triggered Alerts, and Home pages users will see references to the monitors they set up. These visualizations include Alert Rule priority, threshold severities, and more.
Alert Rule Priority
Alert rule priority allows users to specify how important an alert rule is to their workflows, learn more on the Alerts Platform Guide.

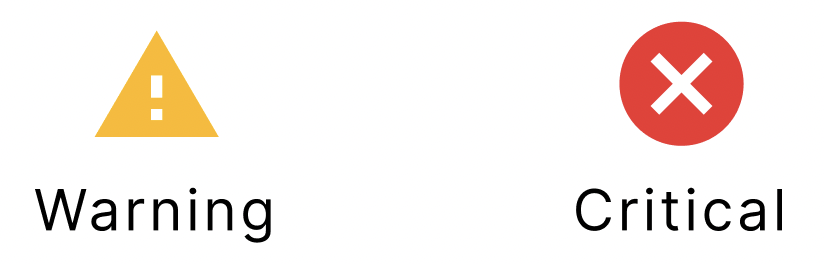
Threshold Severity
Users can specify Warning and Critical thresholds as additional customization on their monitors, learn more on the Alerts Platform Guide.
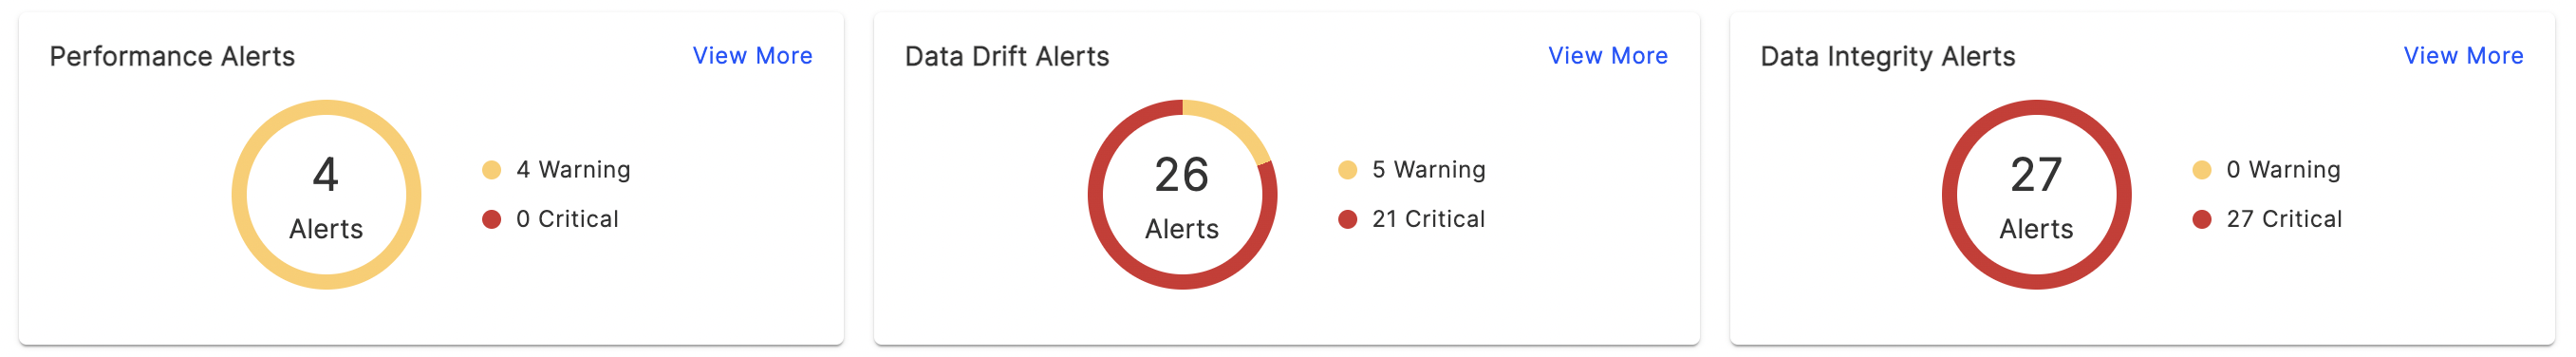
Alert Summary
On the Fiddler home page, users can get a summary glance of their triggered alerts, categorized by Alert Type. This view allows users to easily navigate to their degraded models.
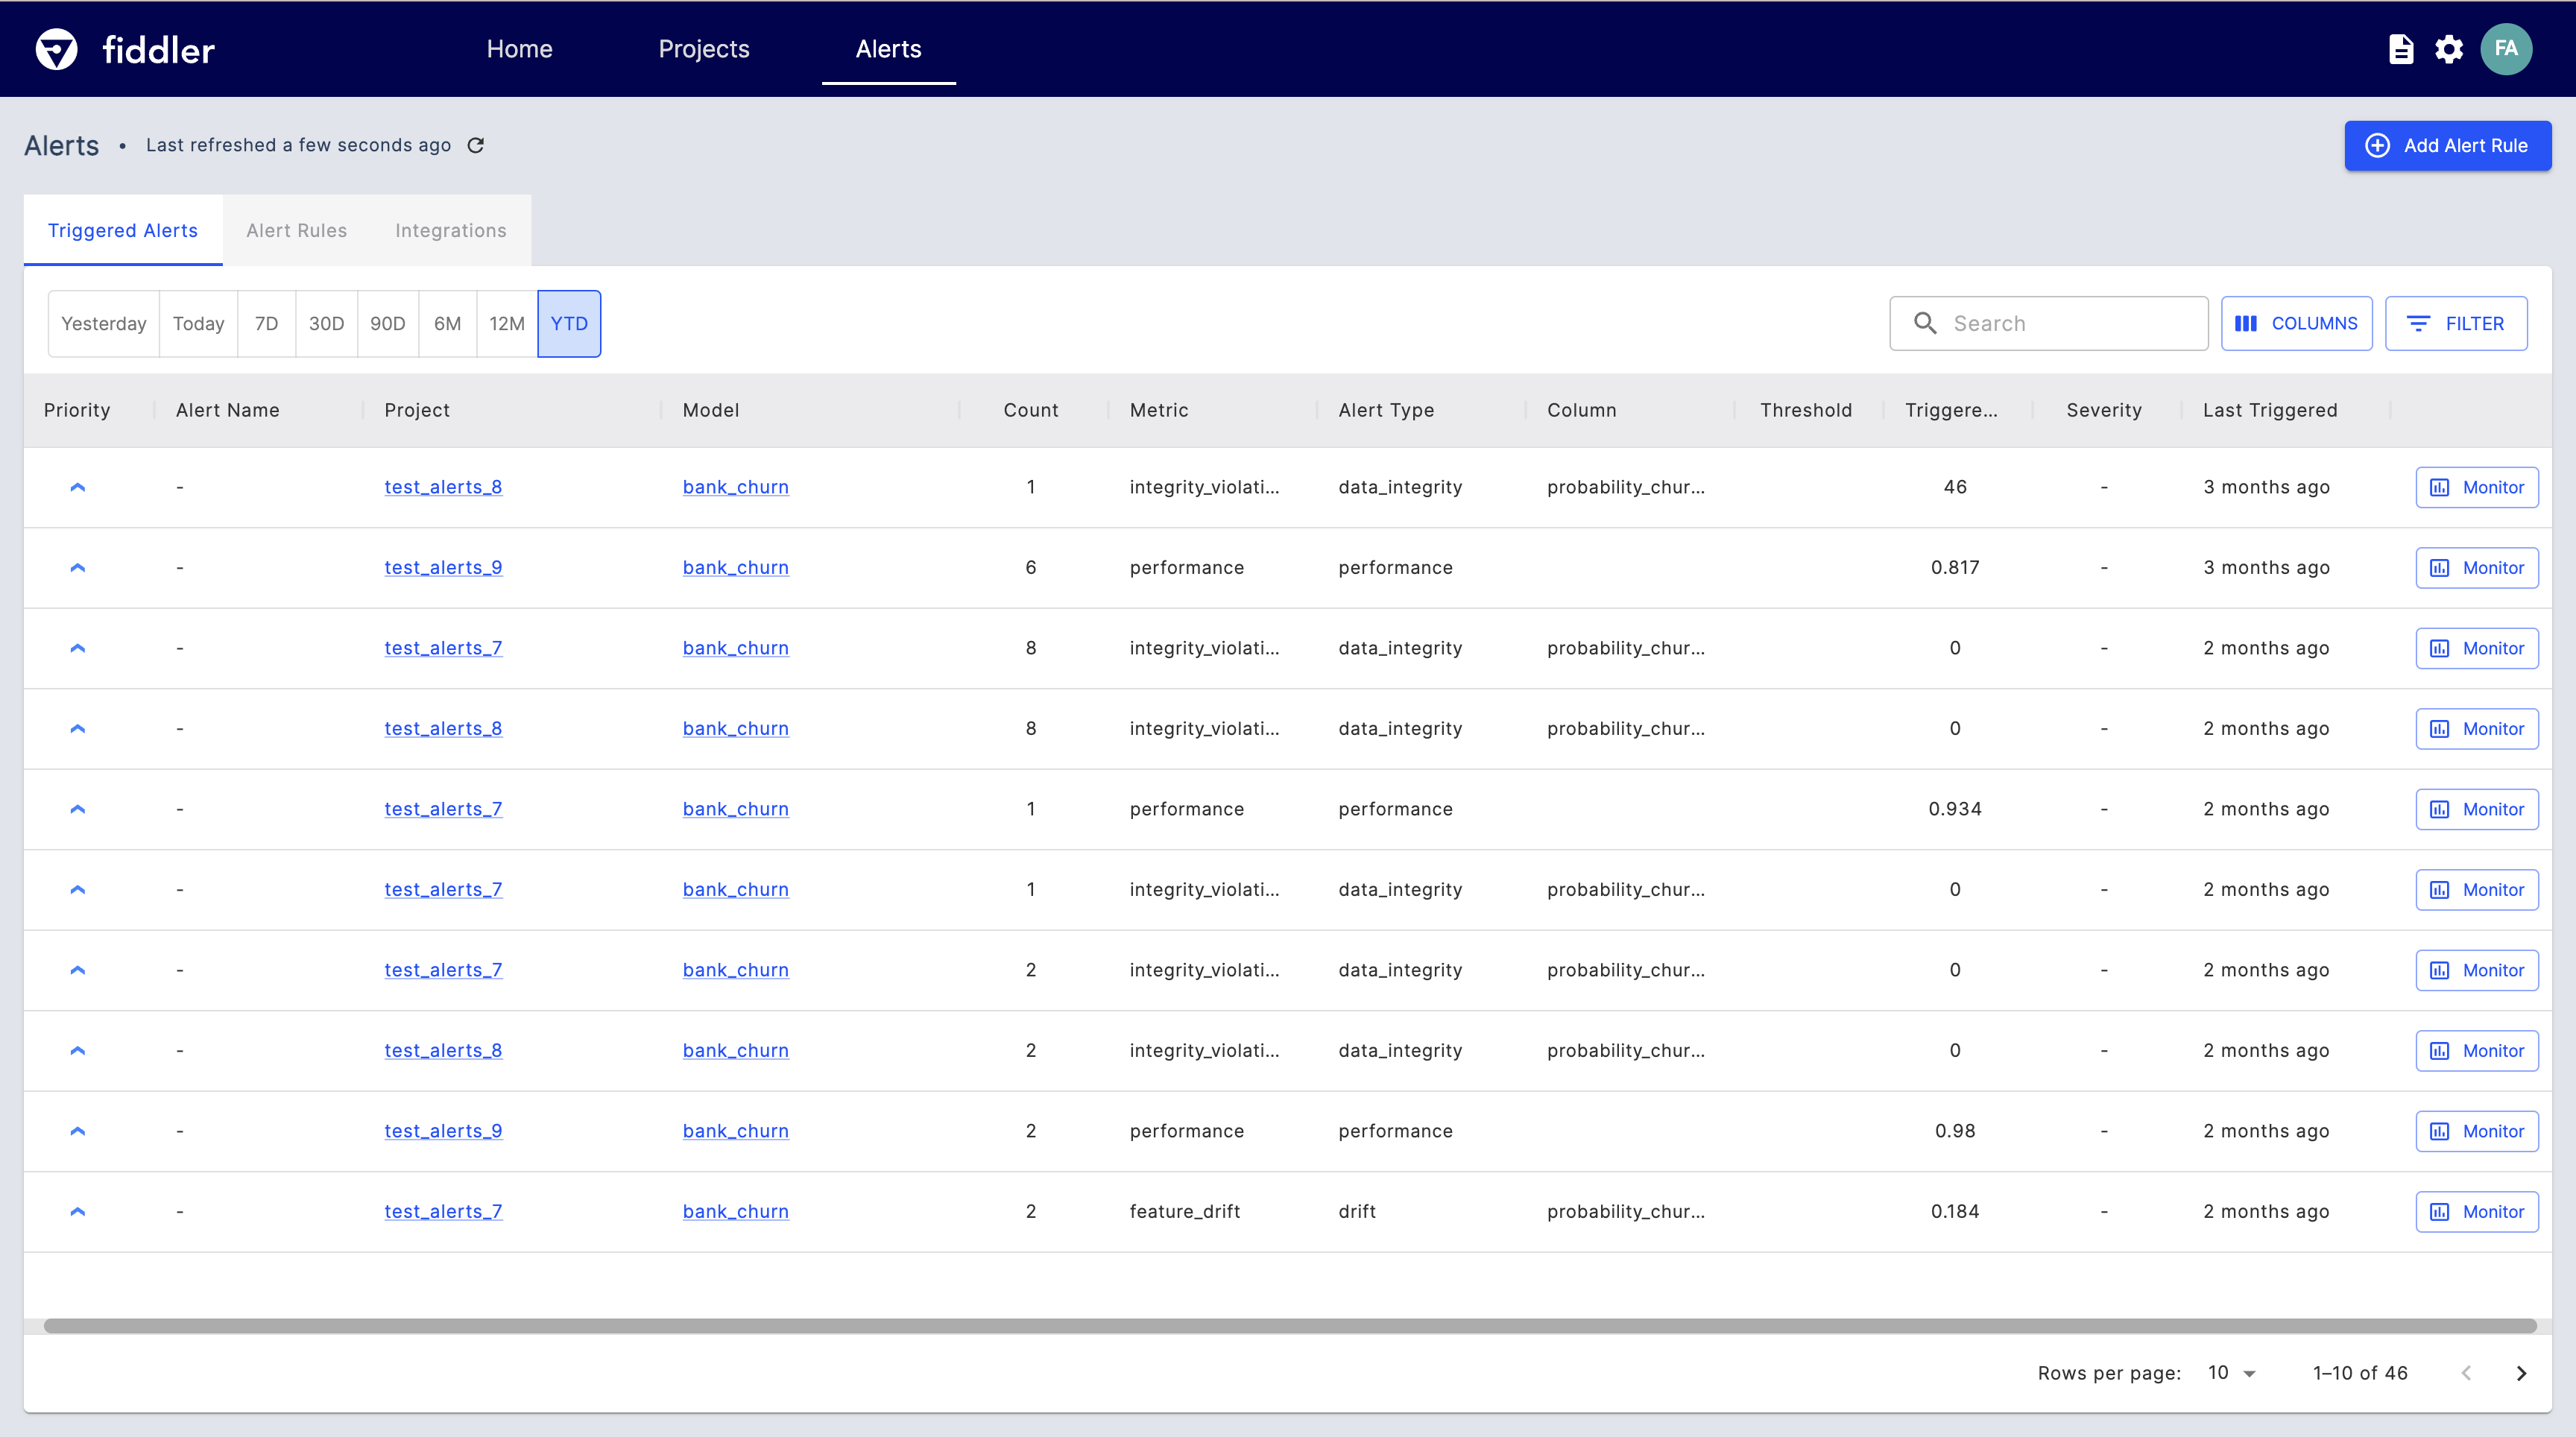
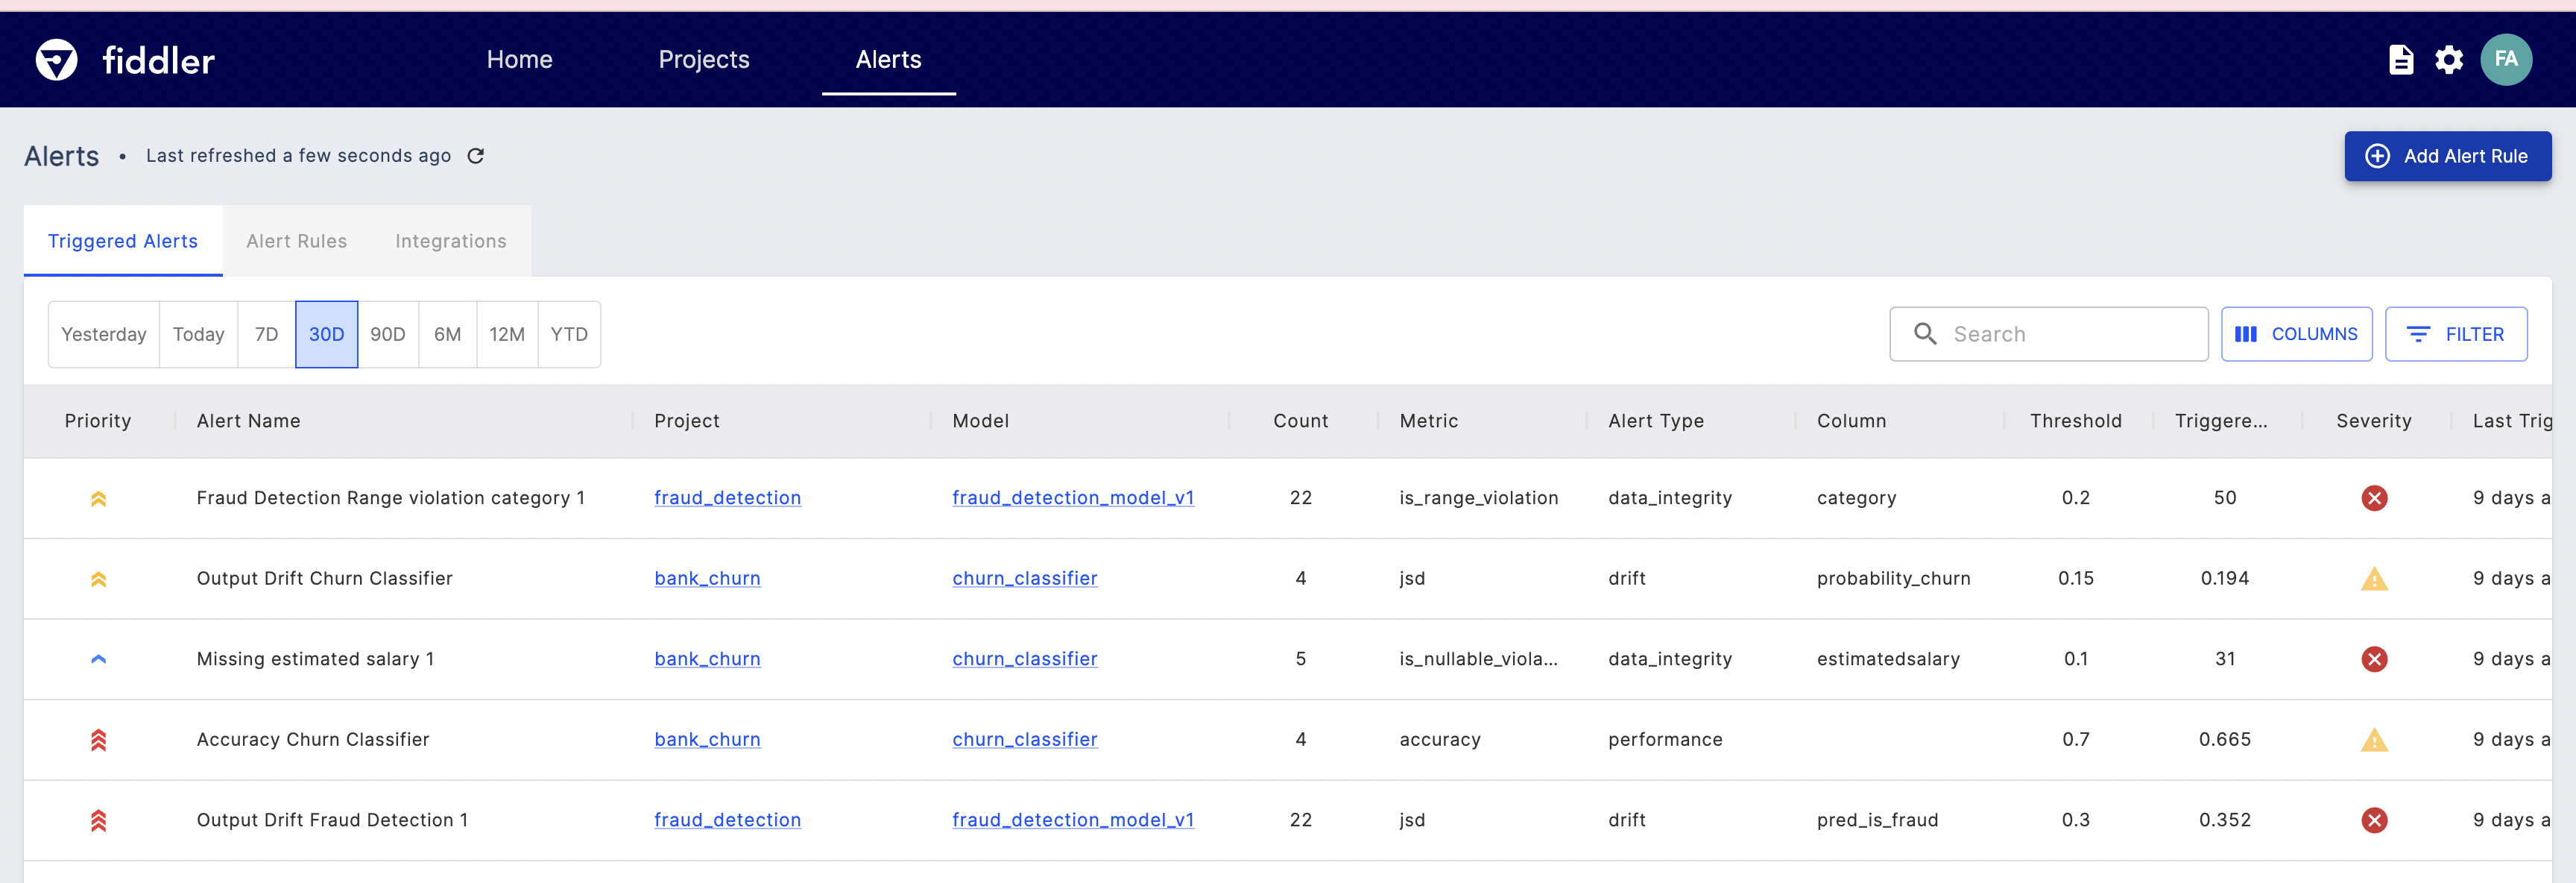
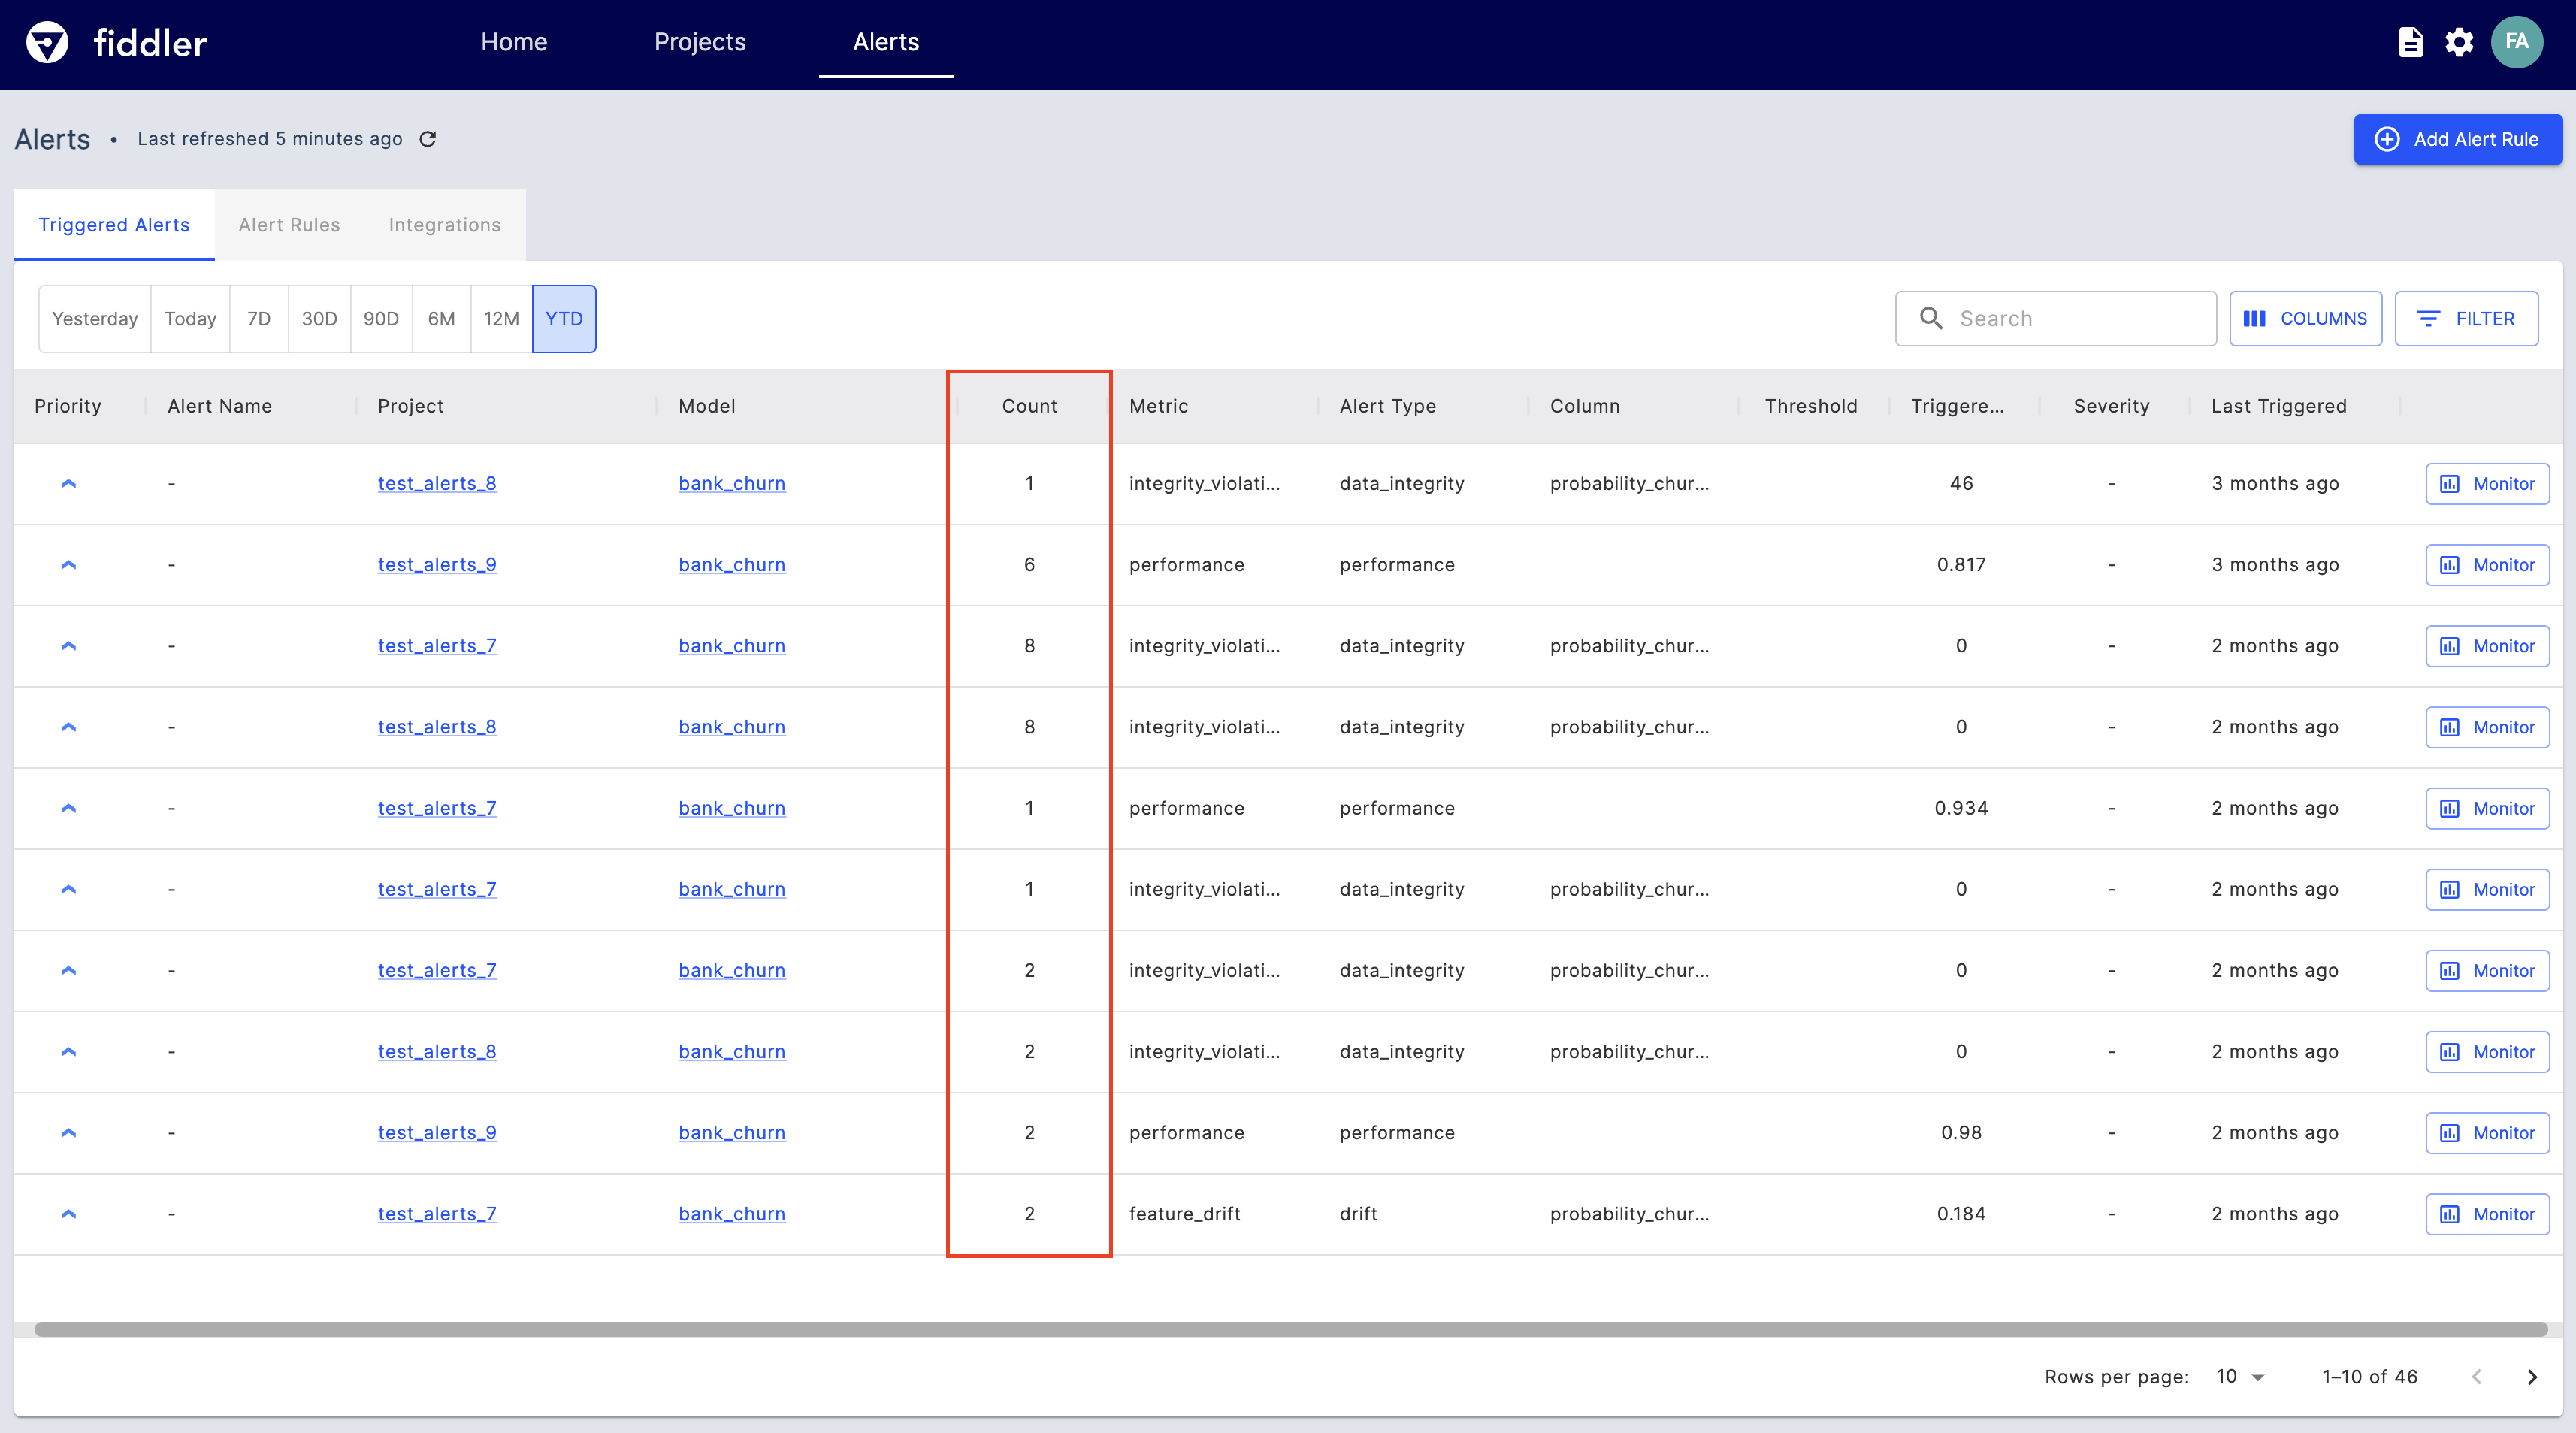
View Triggered Alerts on Fiddler
The Triggered Alerts view gives a single pane of glass experience where you can view all triggered alerts across any Project and Model. Easily apply time filters to see alerts that fired in a desired range, or customize the table to only show columns that matter the most to you. This view aggregates all triggered alerts by alert rule, where the number of times a given alert rule has been triggered is called out by the Count column. Explore the triggered alerts further by clicking on the Monitor button to further diagnose your model and data.
Triggered Alert Revisions
Say goodbye to stale alerts! Triggered Alert Revisions mark a leap forward in alert intelligence, giving you the confidence to act decisively and optimize your operations.
Alerts now adapt to changing data. If new information emerges that alters an alert's severity or value, the alert automatically updates you with highlights in the user interface and revised notifications. This approach empowers you to:
- Make informed decisions based on real-time data: No more relying on outdated or inaccurate alerts.
- Focus on critical issues: Updated alerts prioritize the most relevant information.
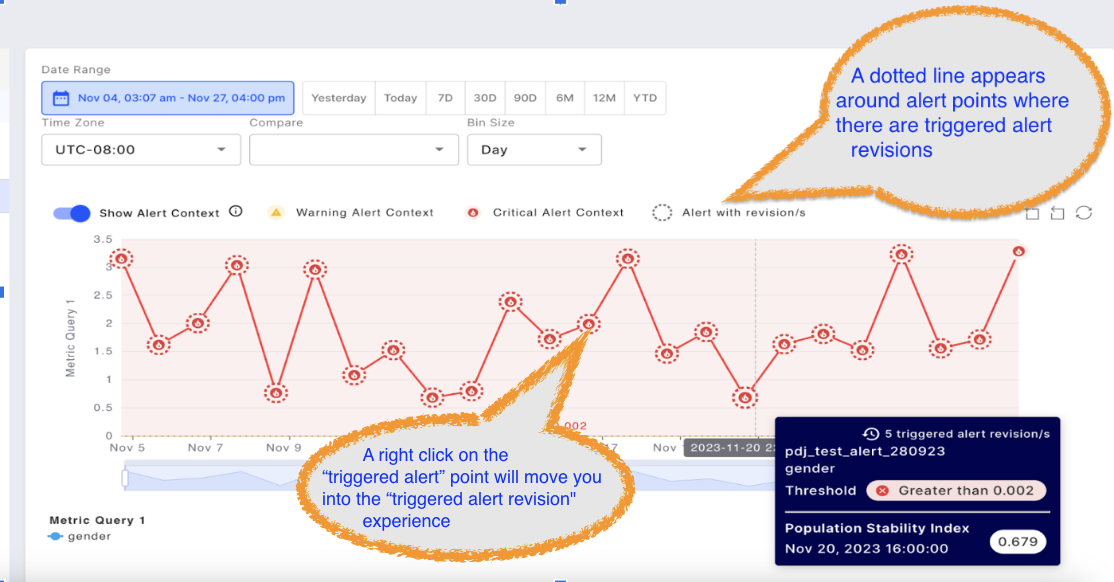
Inspect Alert experience
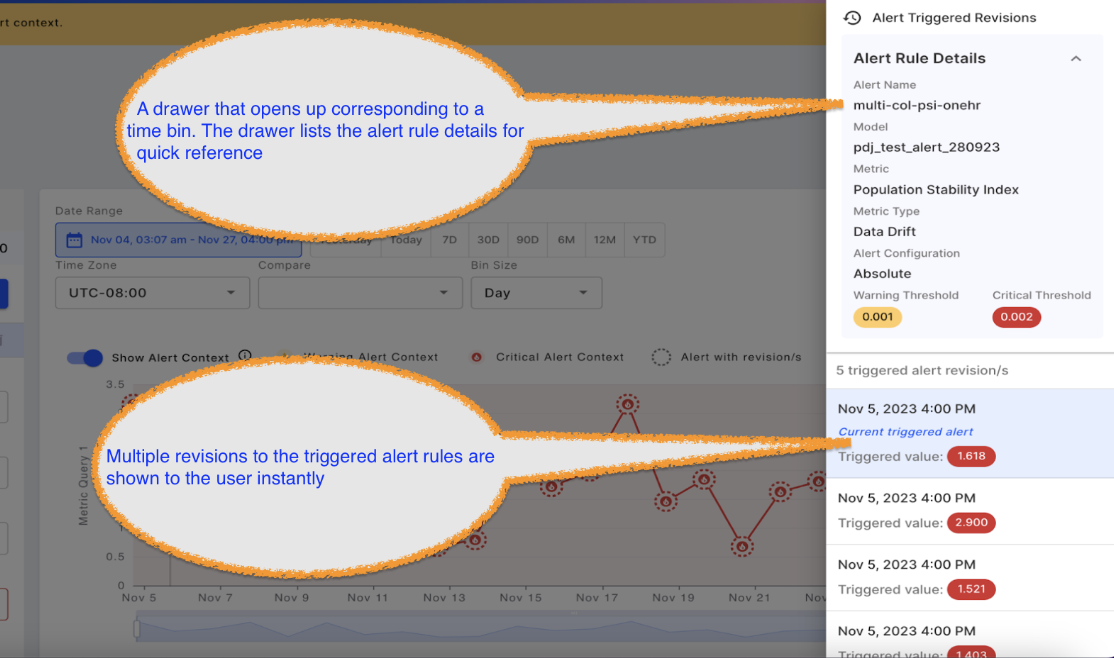
Triggered Alert revision experience
Sample Alert Email
Here's a sample of an email that's sent if an alert is triggered:

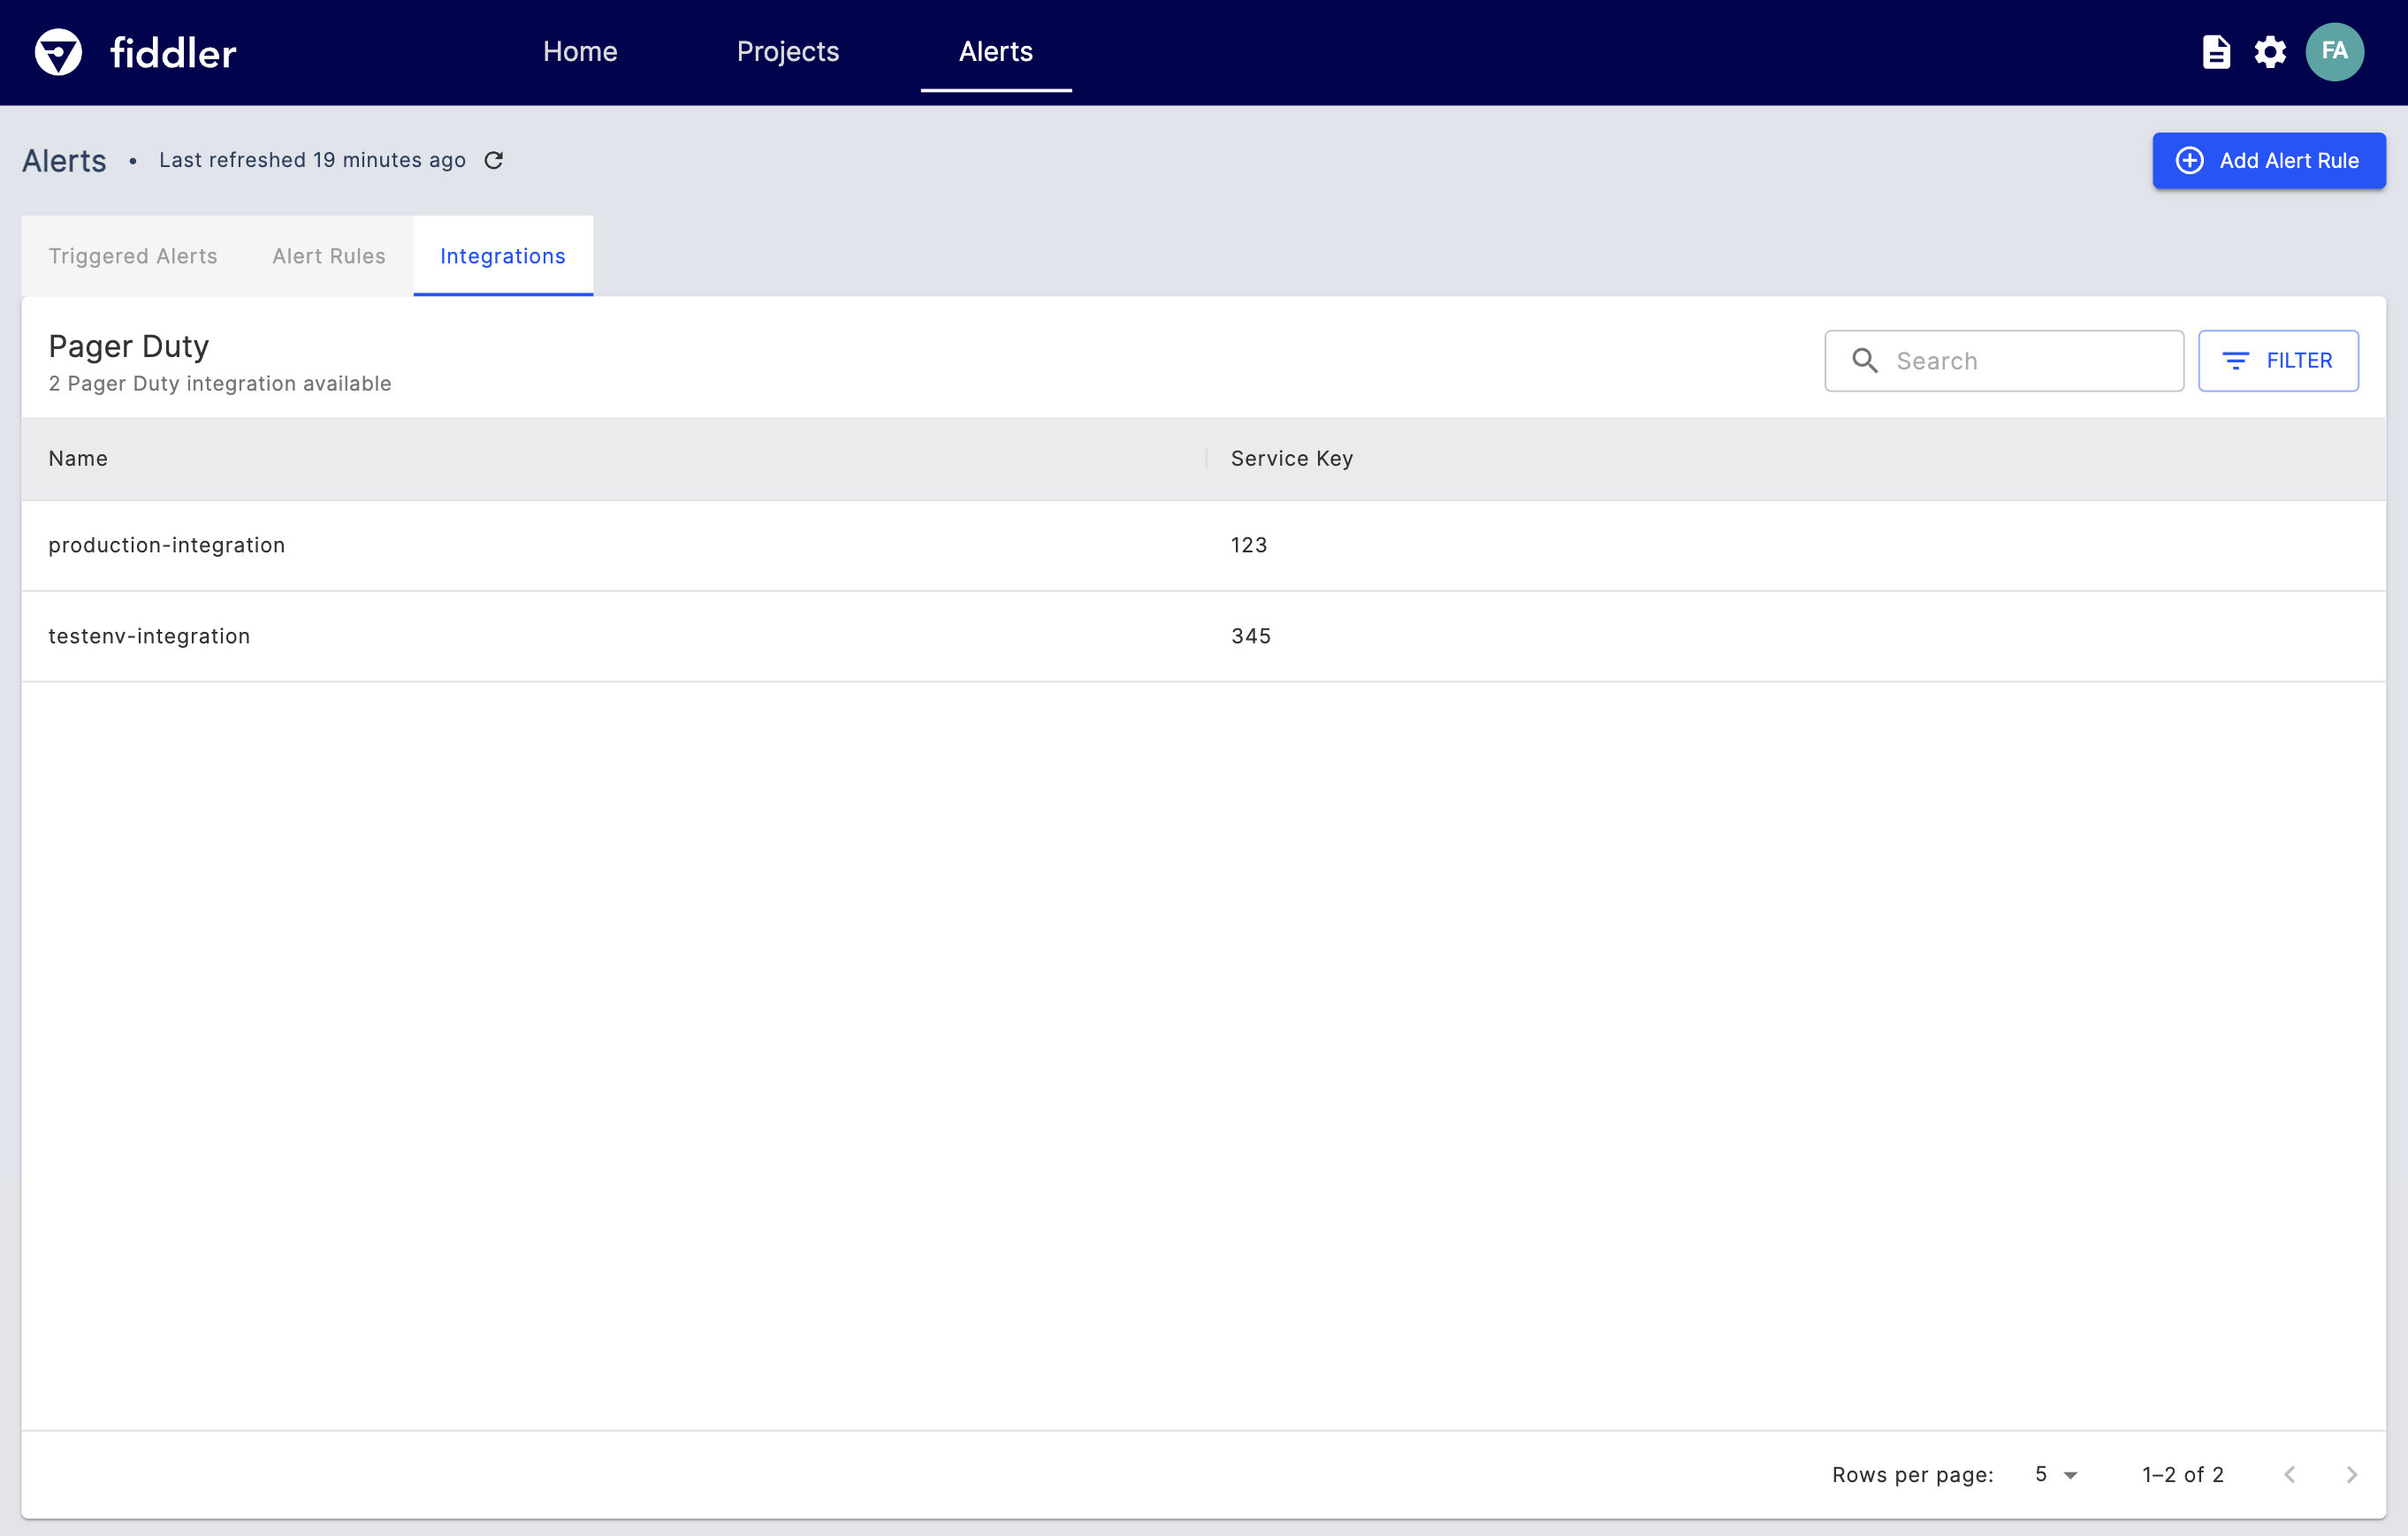
Integrations
The Integrations tab is a read-only view of all the integrations your Admin has enabled for use. As of today, users can configure their Alert Rules to notify them via email or Pager Duty services.
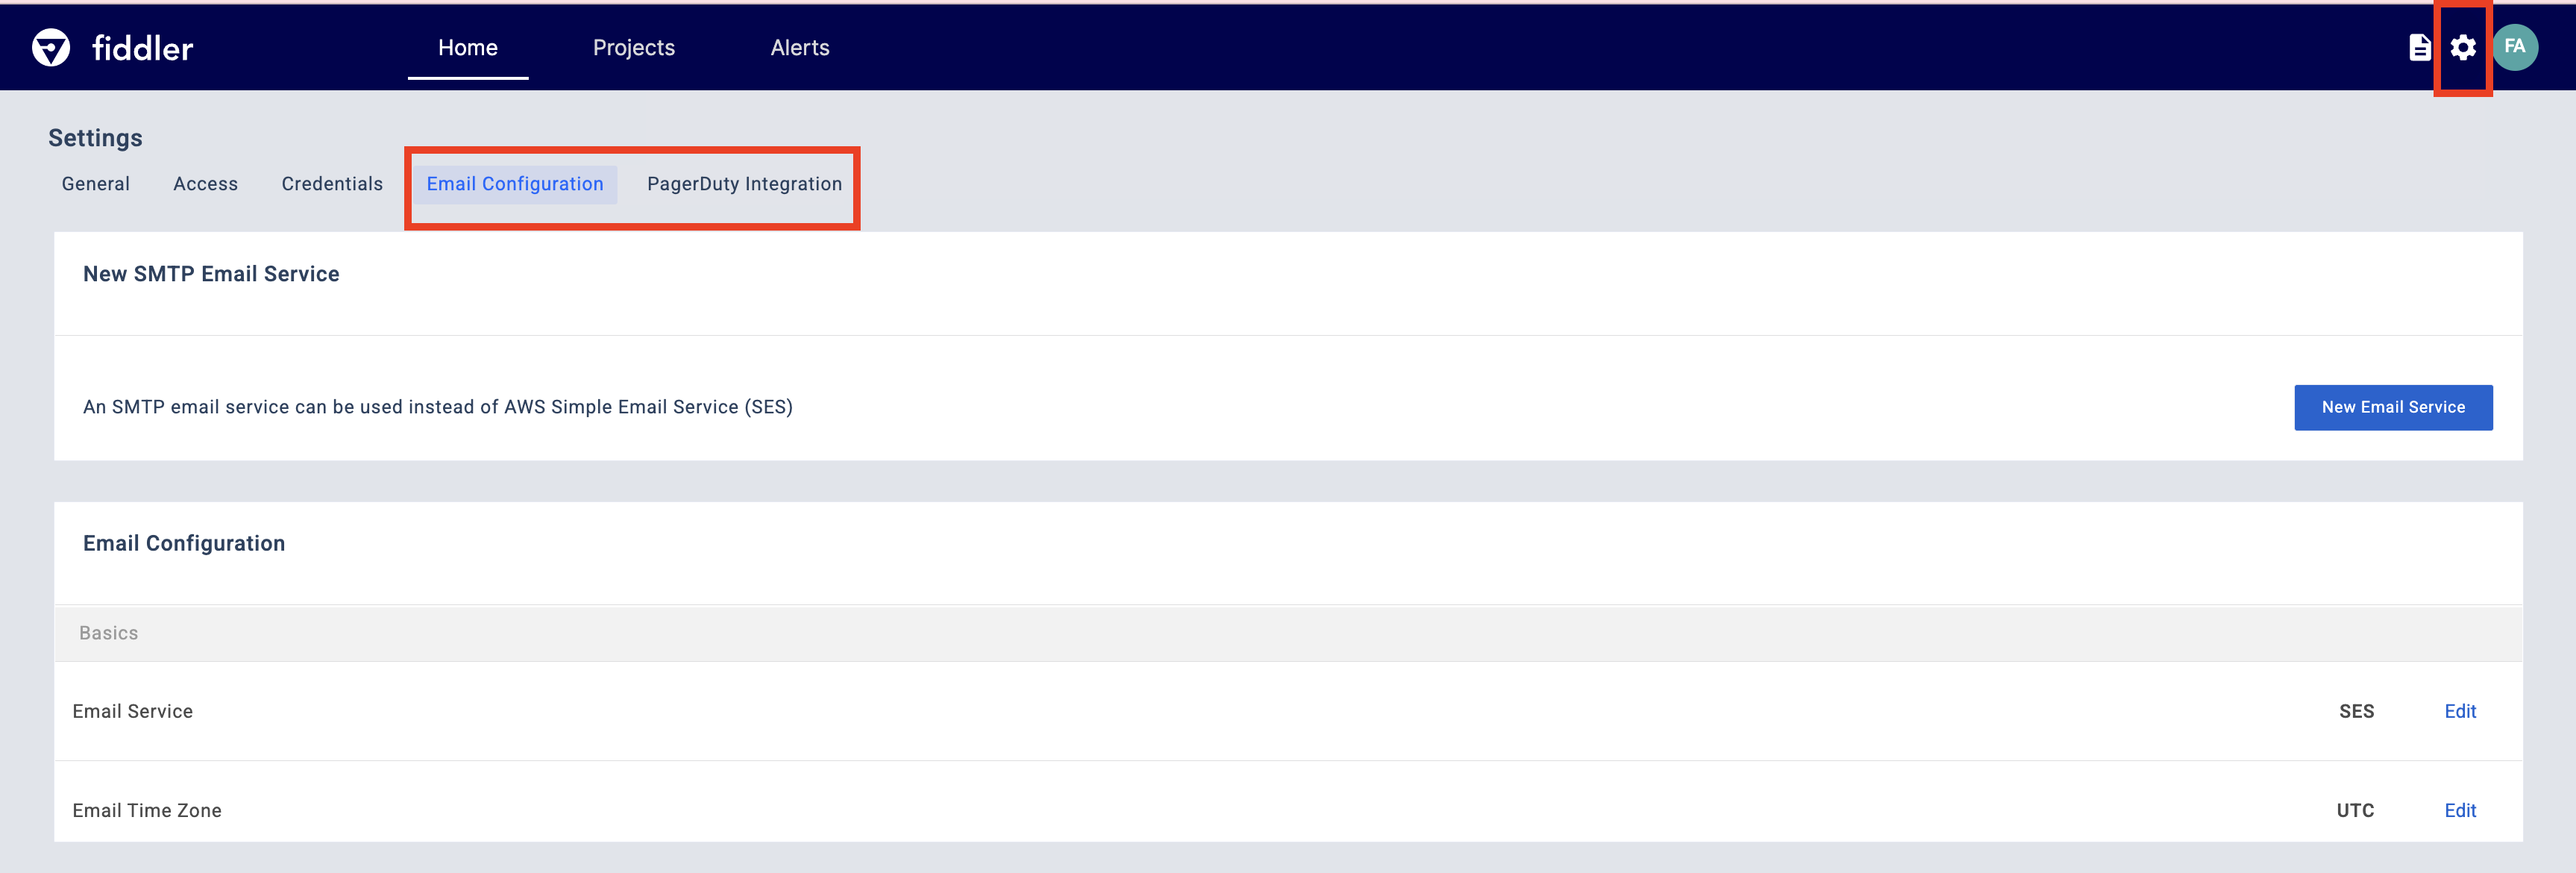
Admins can add new integrations by clicking on the setting cog icon in the main navigation bar and selecting the integration tab of interest.
↪ Questions? Join our community Slack to talk to a product expert
Updated 2 days ago