
 Instrument your LangGraph agent applications and custom AI workflows with OpenTelemetry-based tracing for comprehensive agentic observability. The Fiddler LangGraph SDK provides three instrumentation approaches — auto-instrumentation for LangGraph workflows, decorator-based tracing for custom functions, and manual span creation for fine-grained control — capturing every step from thought to action to execution.
What you’ll need
- Fiddler account (cloud or on-premises)
- Python 3.10-3.14
- LangGraph or LangChain application
- Fiddler API key and application ID
Quick start
Get monitoring in 3 steps:This Quick Start uses auto-instrumentation for LangGraph applications. For custom functions or fine-grained control, see Instrumentation Methods below.
What gets monitored
The LangGraph SDK automatically captures:Hierarchical tracing
- Application Level - Overall system performance and health
- Session Level - User interaction and conversation flows
- Agent Level - Individual agent behavior and decisions
- Span Level - Tool calls, LLM requests, state transitions
Agent lifecycle stages
Every agent operation is tracked through five observable stages:- Thought - Data ingestion, context retrieval, information interpretation
- Action - Planning processes, tool selection, decision-making
- Execution - Task performance, API calls, external integrations
- Reflection - Self-evaluation, learning signals, adaptation
- Alignment - Trust validation, safety checks, policy enforcement
Captured data
- Agent state transitions and decision points
- Tool invocations with inputs and outputs
- LLM API calls with prompts and responses
- Execution times and latency metrics
- Error traces and exception handling
- Custom metadata and tags
Application setup
Before instrumenting your application, you must create an application in Fiddler and obtain your Application ID:1. Create your application in Fiddler
Log in to your Fiddler instance and navigate to GenAI Applications, then click Add Application and follow the onboarding wizard to create your application.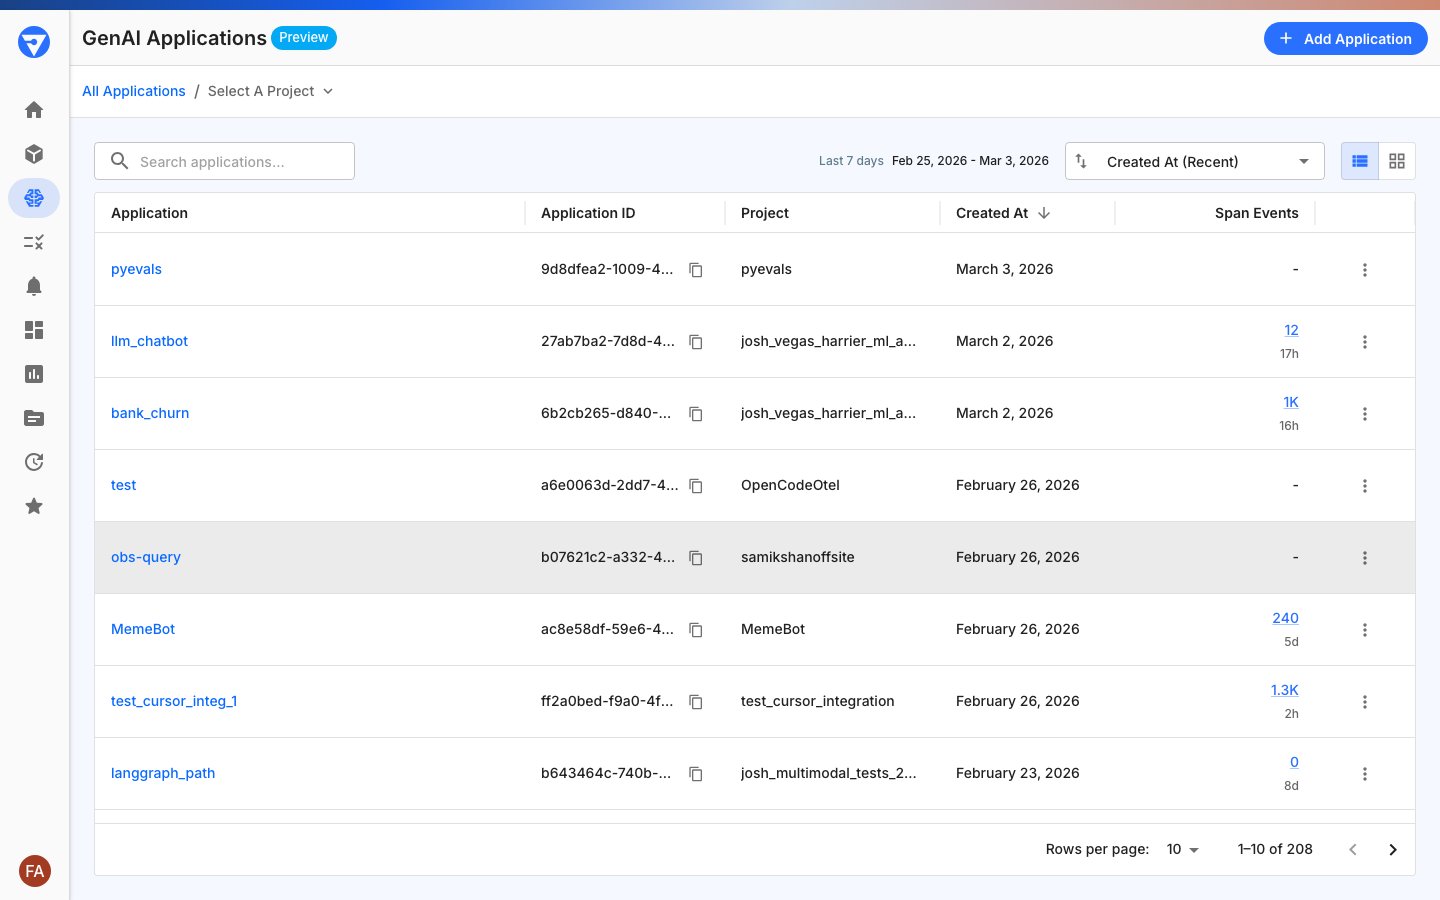
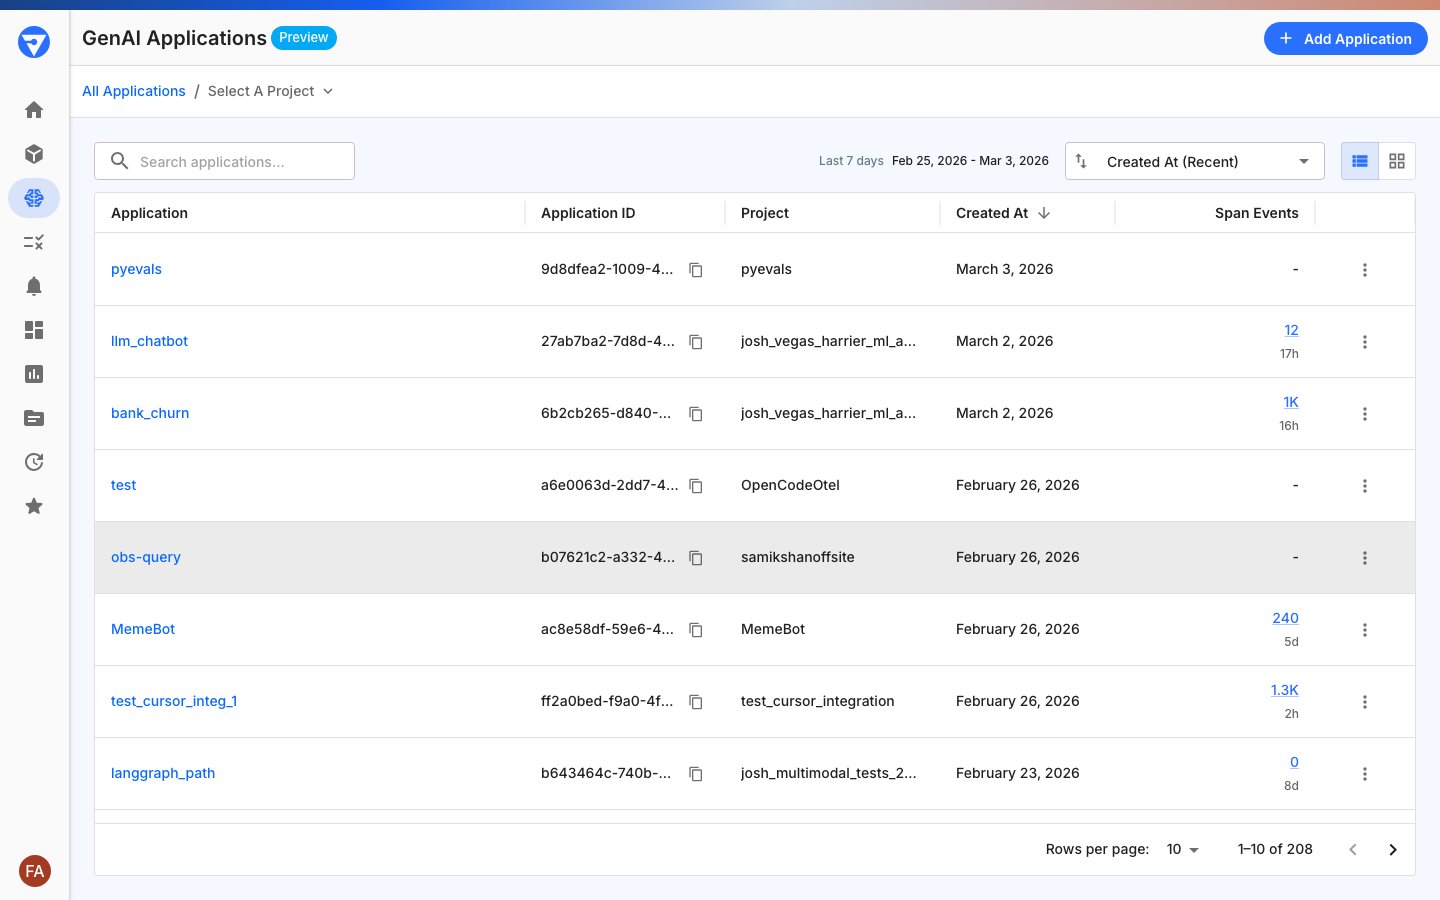
2. Copy your Application ID
After creating your application, copy the Application ID from the GenAI Applications page using the copy icon next to the ID. This must be a valid UUID4 format (for example,550e8400-e29b-41d4-a716-446655440000). You’ll need this for initialization.
3. Get your access token
Go to Settings > Credentials and copy your access token. You’ll need this for initialization.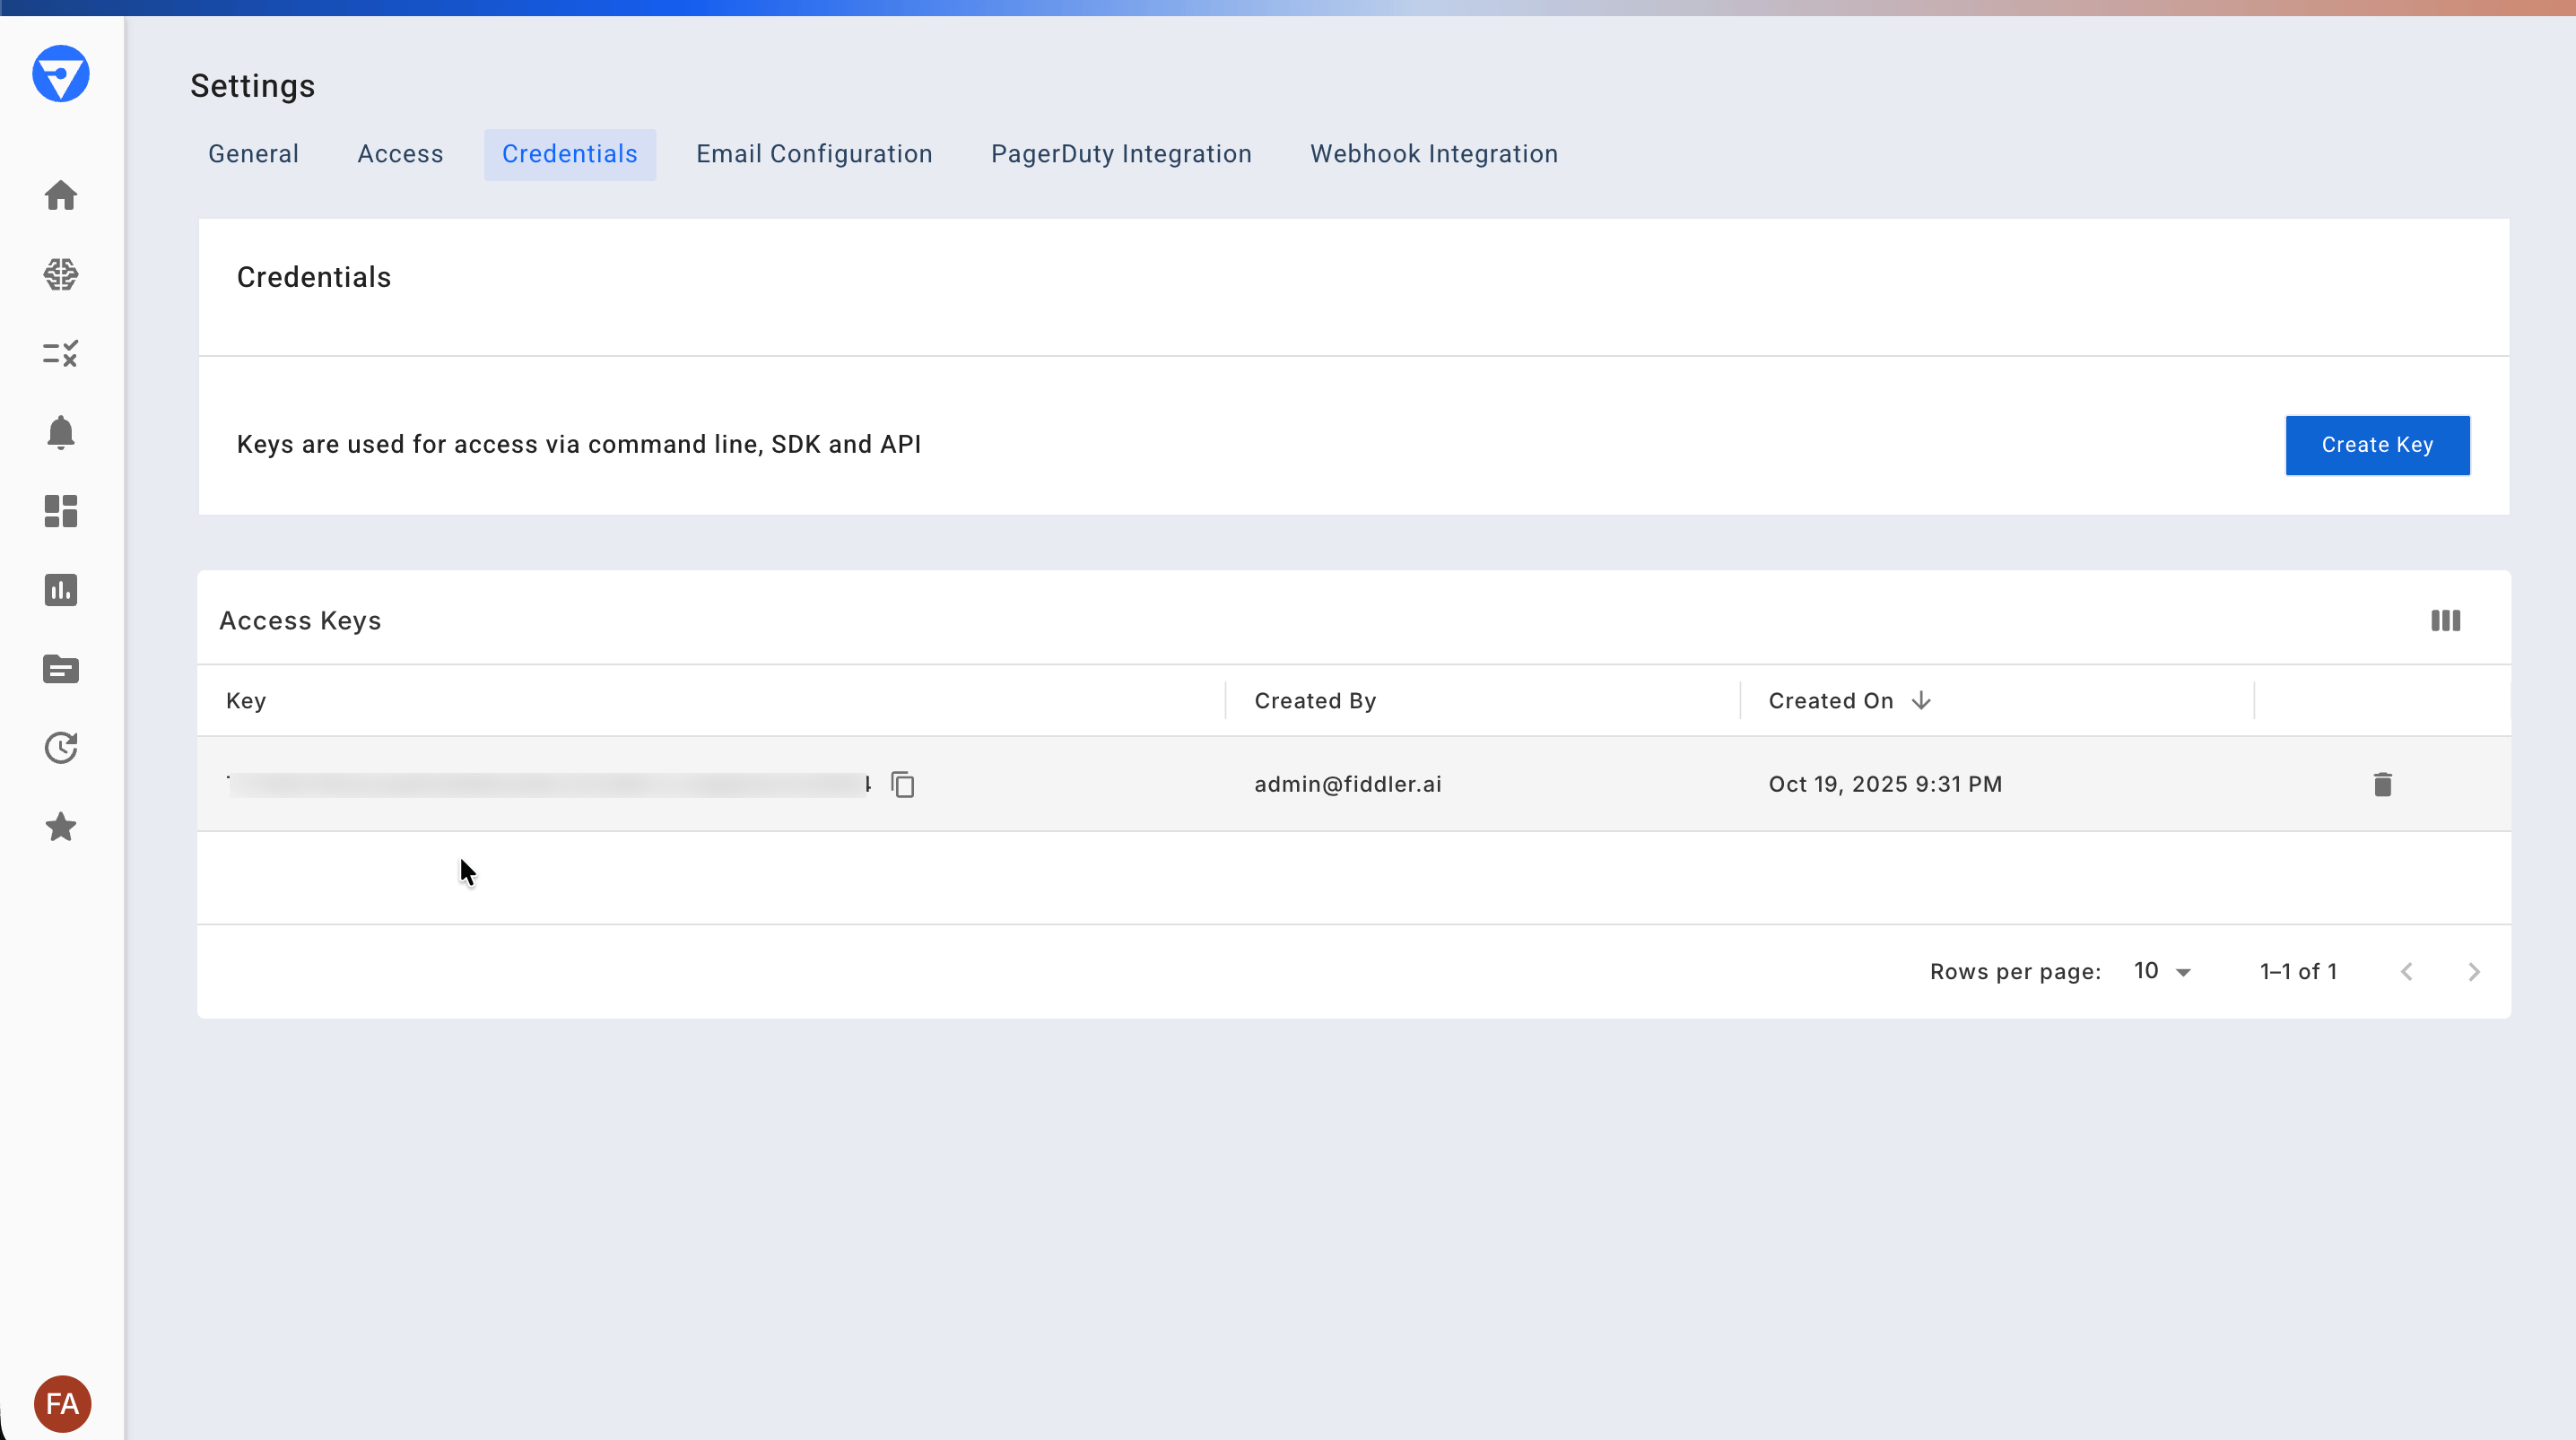
Detailed setup
Installation
- LangGraph: >= 1.0.0 and < 2.0.0; LangChain Core: >= 1.3.3
- Python: 3.10, 3.11, 3.12, 3.13, or 3.14
- OpenTelemetry: API and SDK >= 1.28.0 (installed automatically through fiddler-otel)
Configuration
Direct initialization (Recommended)
Using environment variables
You can use environment variables instead of hardcoding credentials:Instrumentation methods
The Fiddler LangGraph SDK provides three instrumentation approaches. Choose the one that fits your application:You can combine all three approaches in the same application. For example, use auto-instrumentation for your LangGraph graph and decorators for custom helper functions that the graph calls.
Auto-Instrumentation
Auto-instrumentation captures LangGraph and LangChain workflows automatically. Initialize the instrumentor once, and all graph invocations produce traces with no additional code changes.StateGraph or LangChain runnables and you want comprehensive tracing with zero instrumentation code.
See the Quick Start section above for a complete walkthrough, or the Advanced Usage section for context enrichment and production configuration.
Decorator-based instrumentation
Use the@trace() decorator to instrument individual Python functions. This is the recommended approach for custom functions that are not part of a LangGraph graph, such as standalone LLM calls, tool implementations, or orchestration logic.
@trace() Arguments
Accessing the current span
Inside a decorated function, callget_current_span() to access the active span and add metadata:
as_type to get a type-specific wrapper with semantic helper methods. See Span Types and Helper Methods for the full list.
Always check
if span: before calling helper methods. get_current_span() returns None if no Fiddler span is active — for example, during unit tests or when the client is not initialized.Async support
The@trace() decorator works with both sync and async functions. No additional configuration is needed:
Automatic parent-child relationships
Nested decorated functions create proper span hierarchies automatically. The outer function becomes the parent span, and inner calls become child spans:Manual instrumentation
Create spans manually using context managers or explicit start/end calls. This gives you full control over span lifecycle — useful for dynamic span creation, conditional instrumentation, or code where decorator syntax does not apply.Context manager (automatic lifecycle)
Usestart_as_current_span() to create a span that ends automatically when the block exits:
Explicit span control
Usestart_span() when you need to manage span lifecycle manually — for example, in callback-driven or event-based code:
Span types and helper methods
Both decorator and manual instrumentation support four span types. Set theas_type parameter to select a type, which determines which semantic helper methods are available on the span wrapper.
Common methods (all types)
Generation methods (FiddlerGeneration)
Tool methods (FiddlerTool)
For complete API documentation, see the LangGraph SDK API Reference.
Context isolation
The Fiddler LangGraph SDK maintains its own isolated OpenTelemetry context. Fiddler traces do not interfere with other OpenTelemetry tracers that may be active in your application, and vice versa. EachFiddlerClient creates a private Context instance. All span creation, parent-child linking, and context propagation happen within this isolated context. When you use @trace(), start_as_current_span(), or start_span(), the SDK manages context attachment and detachment automatically.
You can verify whether a span belongs to Fiddler using is_fiddler_span():
Global client pattern
The Fiddler SDK uses a singleton pattern forFiddlerClient. The first client created in your process is automatically registered as the global default. Retrieve it anywhere using get_client():
@trace() decorator uses get_client() internally, so you do not need to pass a client to each decorated function. As long as a FiddlerClient has been created somewhere in your application, all @trace() decorators and get_current_span() calls work automatically.
There is no
set_current_client() function. The singleton is set automatically during FiddlerClient initialization. If you create multiple clients, only the first one becomes the global default. Pass an explicit client argument to @trace() to use a different client.Advanced usage
Adding context and metadata
Enrich traces with custom context and conversation tracking:Clearing LLM context for non-RAG steps
In multi-step agent workflows, context set after a RAG retrieval step leaks into subsequent non-RAG LLM calls (tool planning, routing, etc.), causing unintended faithfulness evaluation. Useclear_llm_context() to explicitly remove context before non-RAG steps:
clear_llm_context(llm) is equivalent to set_llm_context(llm, None).
Custom span and session attributes
Add custom attributes to individual spans or entire sessions:Sampling configuration
Control trace sampling for high-volume applications:- High-volume applications: Sample 5-10% (
TraceIdRatioBased(0.05)) - Development/testing: Sample 100% (default - no sampler specified)
- Cost optimization: Sample 1-5% (
TraceIdRatioBased(0.01))
Production configuration
For high-volume production applications, configure span limits and batch processing:Offline and S3 Routing Mode
Use this mode when traces must be routed through an intermediate store (such as Amazon S3) before reaching Fiddler, rather than being sent directly. This is the correct approach when your security or network policies require all data to pass through a controlled intermediary.otlp_enabled=False— disables all direct OTLP export to Fiddler.api_keyandurlare not required in this mode.otlp_json_capture_enabled=True— writes traces to local.jsonfiles in standard OTLP JSON format (ExportTraceServiceRequestenvelope). These files are directly consumable by the Fiddler S3 connector with no reformatting.application_idis still required — even though no data is sent to Fiddler directly, the S3 connector uses theapplication_idembedded in the trace files to route ingested traces to the correct application in Fiddler.
.json files from otlp_json_output_dir to your S3 bucket. The Fiddler S3 connector reads them directly.
Each batch of spans is written to a separate timestamped
.json file in the output directory. The directory is created automatically if it does not exist.Running in AWS SageMaker
Becausefiddler-langgraph exports traces through FiddlerClient, it inherits the Fiddler OTel SDK’s AWS SageMaker Partner App authentication. Install the sagemaker extra (pip install "fiddler-otel[sagemaker]") and set the AWS_PARTNER_APP_AUTH, AWS_PARTNER_APP_ARN, and AWS_PARTNER_APP_URL environment variables — your instrumentation code is unchanged.
Flush and shutdown handling
The SDK uses OpenTelemetry’s batch span processor, which buffers spans in memory and exports them on a schedule. To avoid losing buffered spans when your process exits, use explicit flush and shutdown:- Process exit: The SDK registers an
atexithandler that flushes and shuts down the tracer when the process exits. For short scripts or environments whereatexitmay not run (e.g. SIGKILL, forked processes), callforce_flush()andshutdown()explicitly—for example in atry/finallyor signal handler. - Long-running servers (e.g. FastAPI, uvicorn): On graceful shutdown (SIGTERM), call the Fiddler client’s shutdown so pending spans are exported before the process exits. From async code use
ashutdown()(oraflush()thenashutdown()) so the event loop is not blocked; the syncforce_flush()andshutdown()can block for up to the flush timeout (default 30 seconds).
with FiddlerClient(...) as client: so shutdown() is called automatically when the block exits.
Example applications
Multi-agent travel planner
Customer support agent with tools
Viewing your data
After running your instrumented application:- Navigate to Fiddler UI -
https://your-instance.fiddler.ai - Select “GenAI Applications” - View your application
- Inspect traces - Drill down from application → session → agent → span
- Analyze patterns - Use analytics to identify bottlenecks and errors
Key metrics tracked
- Latency: P50, P95, P99 response times across agents
- Error Rate: Percentage of failed agent executions
- Token Usage: LLM token consumption per agent/session
- Tool Calls: Frequency and success rate of tool invocations
- State Transitions: Agent decision path analysis
Troubleshooting
Application not showing as “Active”
Check your configuration:- Ensure your application executes instrumented code
- Verify your Fiddler access token and application ID are correct
- Check network connectivity to your Fiddler instance
console_tracer=True is additive — span data is printed to stdout and continues to be exported to Fiddler via OTLP. Setting this to True does not disable or suppress the OTLP export to Fiddler. Use it to visually confirm spans are being created during local development.Network connectivity issues
Verify connectivity to your Fiddler instance:- Ensure HTTPS traffic on port 443 is allowed
- Verify your Fiddler instance URL is correct
Import errors
Problem:ModuleNotFoundError: No module named 'fiddler_langgraph'
Solution: Ensure you’ve installed the correct package:
ImportError: cannot import name 'LangGraphInstrumentor'
Solution: Ensure you have the correct import path:
Version compatibility issues
Verify your versions match requirements:Invalid application ID
Problem:ValueError: application_id must be a valid UUID4
Solution: Ensure your Application ID is in proper UUID4 format:
Agent shows as “UNKNOWN_AGENT”
For LangChain applications, ensure you’re setting the agent name in the config parameter:Note: LangGraph applications automatically extract agent names. This manual configuration is only needed for LangChain applications.
OpenTelemetry compatibility
The LangGraph SDK is built on OpenTelemetry Protocol (OTLP). The SDK uses standard OpenTelemetry components, allowing you to:- Integrate with existing observability infrastructure
- Export traces to multiple backends (with custom configuration)
- Use custom OTEL collectors and processors
Related integrations
- Fiddler Evals SDK - Evaluate LangGraph agent quality offline
- Python Client SDK - Additional monitoring capabilities
Migration guides
From LangSmith
From manual tracing
If you’ve built custom tracing, migration is straightforward:API reference
Full SDK documentation:- LangGraph SDK Reference - Complete class and method documentation
Next steps
Now that your application is instrumented:- Explore the data: Check your Fiddler dashboard for traces, metrics, and performance insights
- Learn advanced features: See our Advanced Usage Guide for complex multi-agent scenarios
- Review the SDK reference: Check the Fiddler LangGraph SDK Reference for complete documentation
- Optimize for production: Review configuration options for high-volume applications