First Time Setting Up?Before you can start monitoring your agentic application, you need to create a project and application in Fiddler. See Onboard Your GenAI Application for step-by-step instructions.
What Is Agentic Observability?
Agentic monitoring observes and analyzes AI agent behavior in real-time. Unlike traditional application monitoring that focuses on system metrics, agentic observability captures the unique characteristics of AI workflows:- Agent decision-making processes: How agents choose between different tools and actions
- Multi-step reasoning chains: Complex workflows from initial prompt to final response
- LLM interactions: Model inputs, outputs, and performance across different calls
- Tool usage patterns: How agents utilize external functions and APIs
- Error propagation: How failures cascade through agent workflows
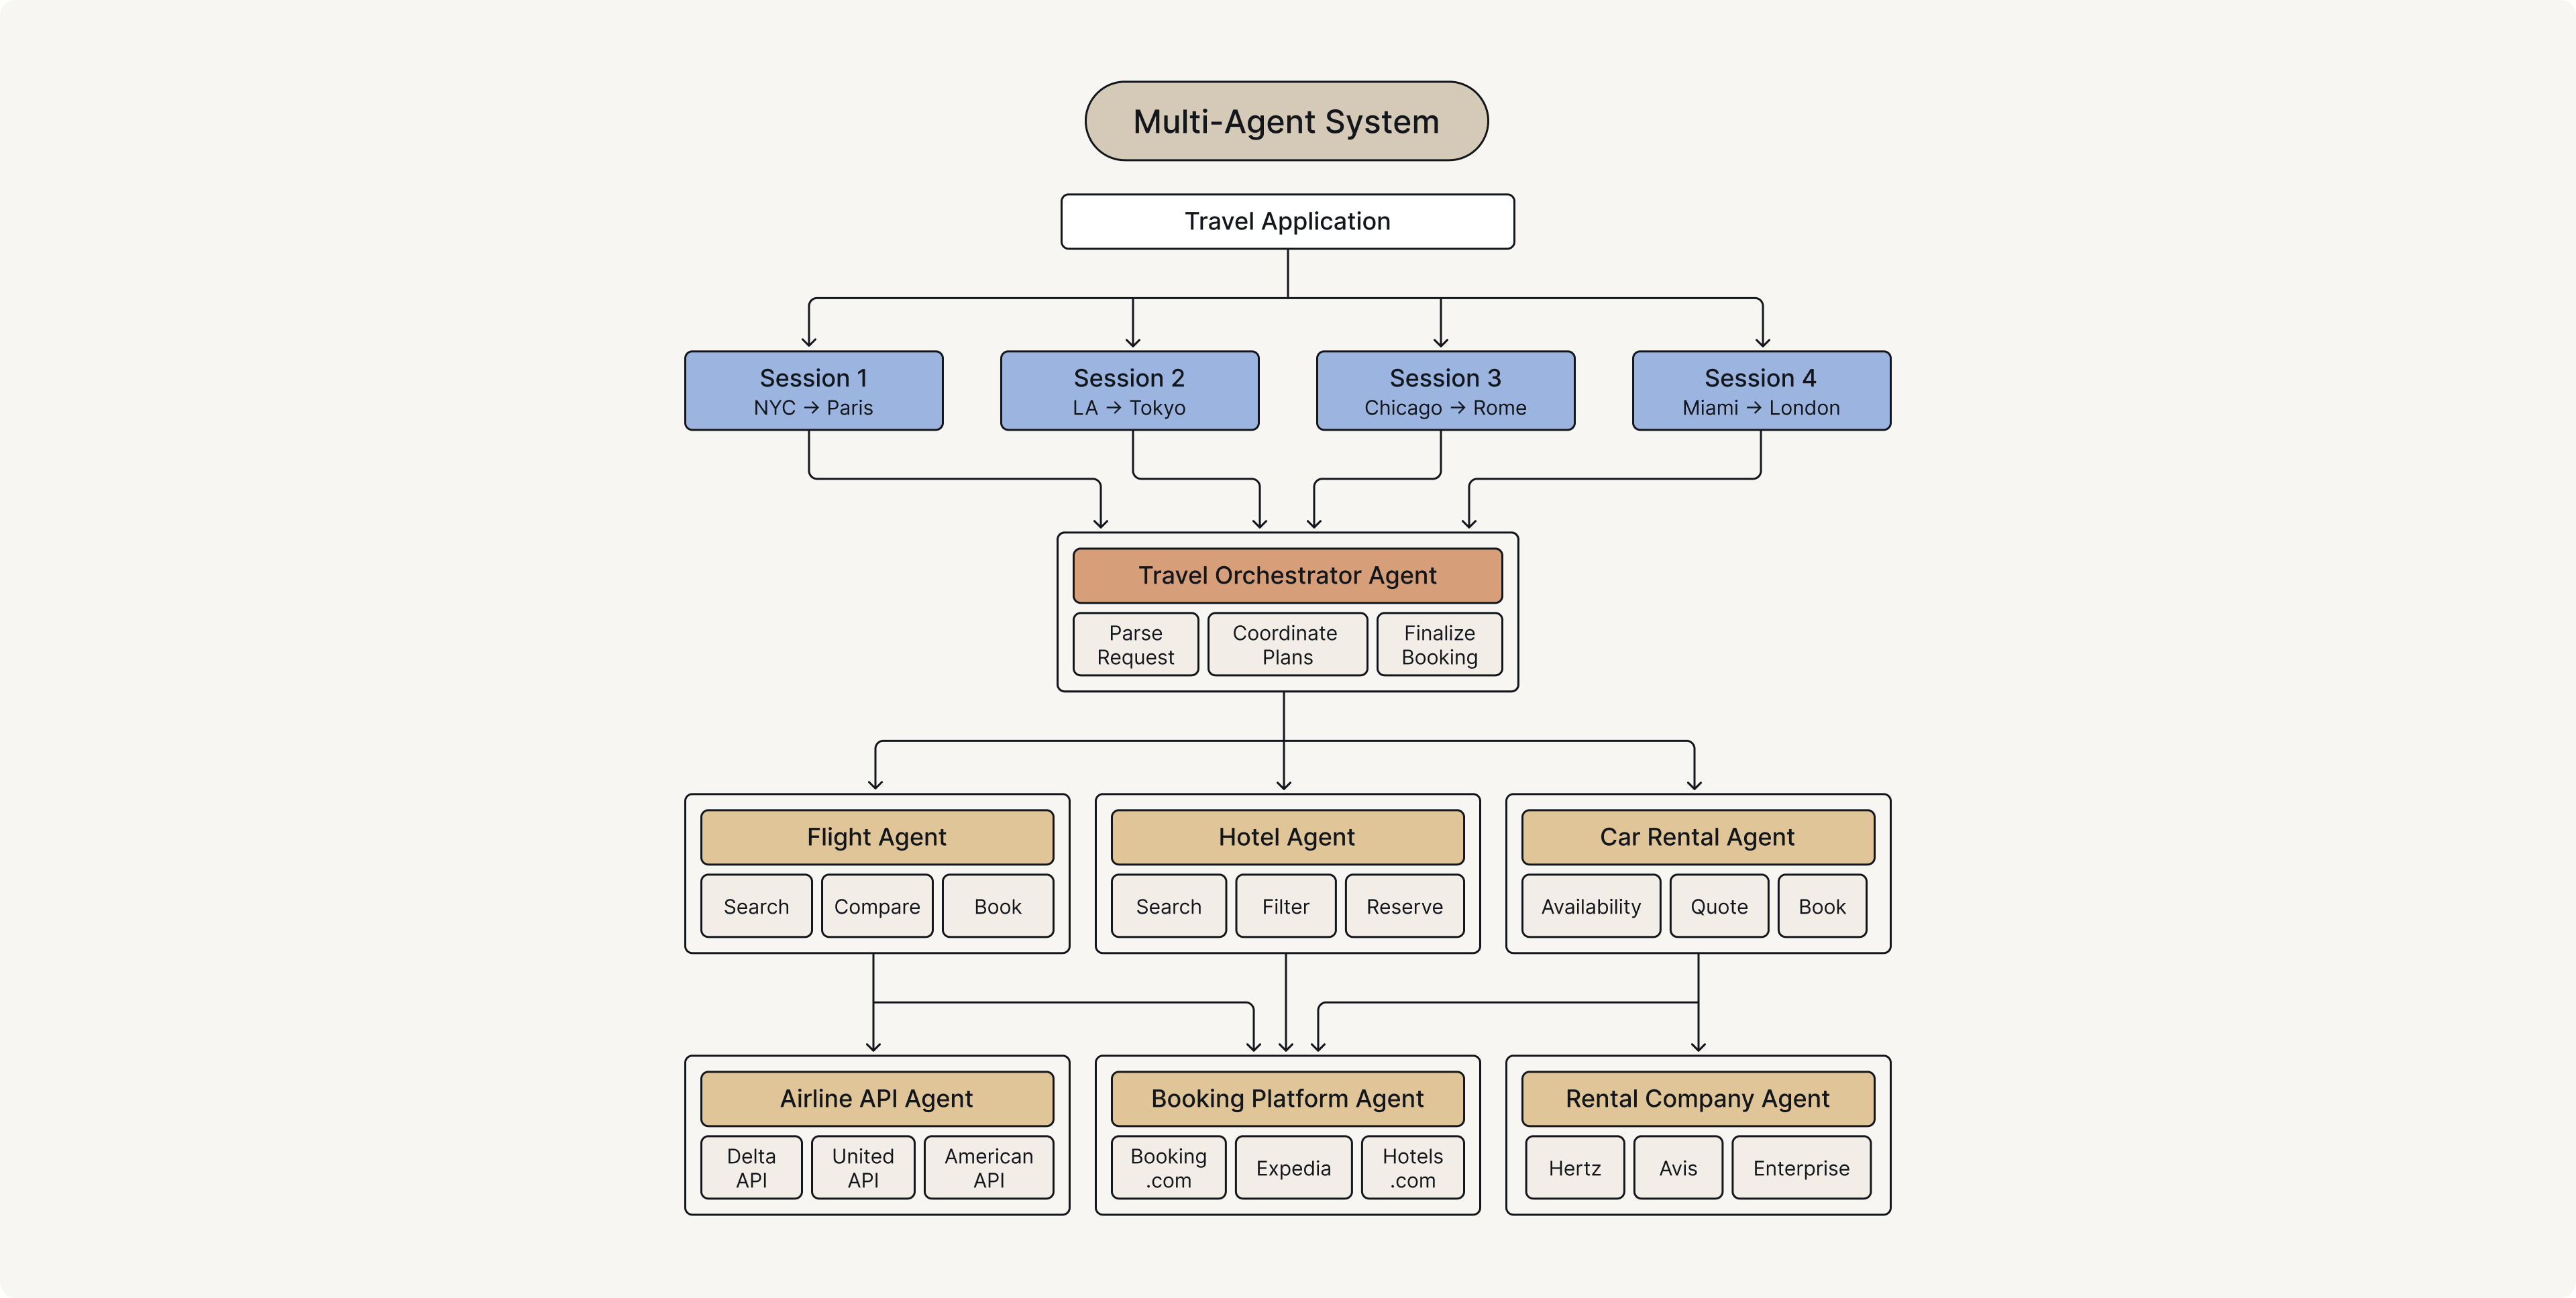
How a Fiddler SDK instruments an agentic application and exports traces to the Fiddler platform
Why Agentic Observability Matters
GenAI applications present unique observability challenges that traditional monitoring approaches can’t address:Complexity and Opacity
AI agents make autonomous decisions that are difficult to predict or understand. Without proper monitoring, you can’t debug agent behavior in production or understand why an agent made specific choices.Dynamic Workflows
Unlike traditional applications with fixed execution paths, AI agents create dynamic workflows based on context and available tools. You need to trace the actual execution path for each interaction.Performance Variability
LLM response times and quality vary significantly based on model load, prompt complexity, and external factors. Monitoring helps you identify performance patterns and optimize accordingly.Cost Management
GenAI applications consume tokens and compute resources with each LLM call. Understanding usage patterns helps you optimize costs and prevent unexpected billing spikes.Quality Assurance
AI outputs vary in quality and accuracy. Monitoring helps you identify when agents produce suboptimal results and understand the conditions that lead to better performance.Integration Options
Fiddler provides flexible integration options to instrument your agentic applications, regardless of the framework you’re using. Choose the approach that best fits your technology stack:- LangGraph & LangChain SDK — automatic instrumentation with minimal code changes for applications built with LangGraph or LangChain. Initialize the client, and your agent workflows are monitored automatically.
- Strands SDK — native integration with the Strands framework for monitoring without additional instrumentation code.
- OpenTelemetry — direct instrumentation for custom frameworks, non-Python applications, or when you need maximum control. Works with any programming language.
Integration Comparison
How Agentic Observability Works
Regardless of which integration method you choose, Fiddler’s agentic observability provides the same comprehensive observability capabilities:Built on OpenTelemetry Standards
All Fiddler agentic observability solutions leverage OpenTelemetry (OTeL), the industry standard for observability. This ensures compatibility with existing monitoring infrastructure, vendor neutrality, and future-proofing of your investment.Automatic or Manual Instrumentation
Depending on your integration choice, you can collect telemetry data automatically or with fine-grained control: Automatic Instrumentation (LangGraph & Strands SDKs):- Zero-code or minimal-code setup
- Automatically captures all agent interactions
- Best for rapid deployment and standard use cases
- Full control over what data is captured
- Custom span attributes and metadata
- Best for specialized requirements or custom frameworks
- Distributed traces: Complete execution flow
- Span attributes: Inputs, outputs, and metadata
- Performance metrics: Timing and resource usage
- Error tracking: Detailed context and stack traces
Near Real-Time Streaming
Telemetry data streams in near real-time to your Fiddler instance, enabling immediate visibility into agent behavior and rapid response to issues.Architecture Overview
Fiddler’s agentic observability integrates seamlessly into your application architecture, regardless of which integration method you choose:Key Components
- Instrumentation Layer: Captures agent execution events (automatic with SDKs, manual with OpenTelemetry)
- Trace Exporter: Sends telemetry data to Fiddler using OTLP protocol
- Fiddler Client: Manages configuration, authentication, and connection to your Fiddler instance
- OpenTelemetry Integration: Provides industry-standard distributed tracing across all frameworks
What You Can Monitor
Once your agent application is instrumented, Fiddler provides comprehensive observability through dashboards, metrics, and automated evaluations:Dashboards & Visualization
Access specialized dashboards designed for agentic workflows: Pre-Built Agentic Dashboards:- Agent Performance Overview - Monitor success rates, latency, and throughput across all agents
- Workflow Execution Traces - Visualize complete multi-step reasoning chains hierarchically
- Tool Usage Analytics - Track which external tools and APIs your agents are calling
- Error & Exception Tracking - Identify where agent workflows fail and diagnose the root cause
- Agent decision points and reasoning steps
- LLM calls with full inputs, outputs, and metadata
- Tool invocations and API requests
- Timing information for each step
- Parent-child relationships in multi-agent systems
- Build custom dashboards combining multiple charts to track KPIs specific to your use case
- Filter by agent type, user segments, time periods, or custom attributes
- Share dashboards with team members and stakeholders
- Configure alerts based on dashboard metrics
Metrics & Analytics
Fiddler automatically generates specialized metrics for agent monitoring: Agent-Specific Metrics:- Agent Success Rate - Percentage of workflows completing successfully
- Tool Call Distribution - Frequency analysis of tool usage
- Reasoning Chain Length - Average number of steps per workflow
- Agent Handoffs - How often agents delegate to other agents
- Retry & Recovery Rate - Agent resilience and error recovery patterns
- End-to-End Latency - Total time from user request to final response
- Per-Step Latency - Duration of individual reasoning steps, LLM calls, and tool invocations
- Token Usage - LLM consumption tracking across all agent interactions
- API Call Volume - Monitor external tool and API usage patterns
- Response Accuracy - Validate agent outputs (requires ground truth labels)
- Hallucination Detection - Identify when agents generate unsupported claims
- RAG Health Metrics - Diagnose RAG pipeline issues with Answer Relevance 2.0, Context Relevance, and RAG Faithfulness evaluators. Pinpoint whether failures originate in retrieval, generation, or query understanding
- Safety & Guardrails - Track safety violations and guardrail activations
- User Satisfaction - Capture feedback signals from end users
Evaluator Rules
Automated Quality Assessment Evaluator Rules enable automated, continuous evaluation of your agent’s performance directly from production spans and traces. Define once, and Fiddler automatically assesses quality, safety, and performance in real-time. How Evaluator Rules Work:- Configure an Evaluator - Choose from Fiddler-provided evaluators or create custom LLM-as-a-judge evaluators
- Map Inputs - Connect evaluator variables to span attributes from your agent telemetry
- Set Application Rules - Define which spans qualify for evaluation (e.g., only “llm” span types)
- Activate - Evaluations run automatically on all matching spans
- Fiddler-Provided: Topic Classification, Answer Relevance, Coherence, Conciseness, Context Relevance, RAG Faithfulness, PII Detection, Sentiment Analysis, Prompt Safety, Response Faithfulness
- Custom LLM-as-a-Judge: Create domain-specific evaluators with custom prompts and scoring logic
- Automated Quality Monitoring - Continuous evaluation without manual labeling
- Real-Time Insights - Identify quality issues as they happen in production
- Backfill Capability - Apply evaluations retroactively to historical data
- Flexible Filtering - Evaluate specific span types, regions, or custom conditions
What Data Is Captured
All instrumentation methods capture comprehensive data about your agent workflows:Agent Execution Traces
- Workflow structure: Complete hierarchy of agent steps and decisions
- Timing information: Duration of each step and overall execution time
- Agent identification: Unique identifiers for different agents in your system
LLM Interactions
- Model configuration: Model name, temperature, and other parameters
- Input prompts: System messages, user input, and conversation history
- Model outputs: Generated responses, token usage, and completion metadata
- Performance metrics: Response time, tokens consumed, and success rates
Tool and Function Calls
- Tool identification: Names and types of tools used by agents
- Input parameters: Arguments passed to functions and tools
- Output results: Return values and success/failure status
- Execution context: When and why tools were invoked
Error and Exception Handling
- Exception details: Full error messages and stack traces
- Context information: State of the agent when errors occurred
- Recovery attempts: How agents handled and recovered from failures
Key Benefits
Agentic observability with Fiddler provides immediate value across your development lifecycle, helping you move beyond experimentation to deploy production AI confidently:Development and Learning
- Quick setup: Start monitoring with just a few lines of code
- Immediate insights: See agent behavior without complex configuration
- Deep visibility: Understand decision-making processes beyond just inputs and outputs
Performance and Optimization
- Hierarchical root cause analysis: Drill down from application-level issues to specific agent spans to reduce MTTI (Mean Time to Identify) and MTTR (Mean Time to Resolve)
- Application-critical metrics: Monitor performance, costs, and safety through a unified dashboard
- Quality improvement: Understand which patterns lead to better results
Production and Troubleshooting
- Enterprise-grade monitoring: Track agent performance and success rates at Fortune 500 scale
- End-to-end visibility: Complete observability into multi-agent interactions and coordination patterns
- Actionable alerts: Get early warnings on performance issues and cross-agent problems
- Data-driven decisions: Make informed optimizations based on comprehensive telemetry data
Security and Privacy Considerations
Fiddler’s agentic observability is designed with enterprise-grade security and privacy:- Cloud Enterprise compliance: SOC 2 Type 2 security and HIPAA compliance standards
- Data encryption: All telemetry data is encrypted in transit using HTTPS/TLS
- Access control: Role-based access control (RBAC) and SSO for enterprise user management
- Personal access token: Access token-based authentication ensures only authorized access
- Data control: You control what data is captured and sent to Fiddler
- Deployment flexibility: Deploy in Fiddler Cloud or your own cloud
- Compliance: Built on industry-standard OpenTelemetry for compliance requirements
Ready to Get Started?
You’re now ready to add enterprise-grade observability to your agentic and LLM applications. Choose your integration library to get started in under 10 minutes:LangGraph & LangChain
Instrument LangGraph and LangChain apps. ~10 min.
Strands Agents
Instrument Strands agents. ~10 min.
OpenTelemetry
Instrument any framework or language. ~15 min.
Once your application is instrumented, traces appear in your Fiddler dashboard within 1-2 minutes of agent execution.
- Agentic Observability - Dashboards, metrics, and analytics
Frequently Asked Questions
How is this different from traditional APM tools?
How is this different from traditional APM tools?
Traditional APM focuses on system metrics. Agentic observability captures AI-specific behaviors, such as reasoning chains, tool selection, and LLM interactions.
Which integration method should I choose?
Which integration method should I choose?
Choose based on your framework: LangGraph SDK for LangGraph/LangChain apps, Strands SDK for Strands agents, or OpenTelemetry for custom frameworks or non-Python applications. All provide the same monitoring capabilities.
What's the performance overhead?
What's the performance overhead?
With default settings, expect less than 5% overhead. This can be reduced further with sampling.
Is my data secure when using Fiddler's monitoring?
Is my data secure when using Fiddler's monitoring?
Yes, all data is encrypted in transit using HTTPS/TLS, and you retain full control over what data is captured and sent to Fiddler. Fiddler supports deployment in your own cloud environment for maximum security.
How quickly will I see data in my Fiddler dashboard?
How quickly will I see data in my Fiddler dashboard?
Telemetry data streams in near real-time, typically appearing in your dashboard within 1-2 minutes of agent execution.
What happens if my agents fail? Will I still get monitoring data?
What happens if my agents fail? Will I still get monitoring data?
Yes, all instrumentation methods capture comprehensive error information, including exception details, agent state at failure, and recovery attempts, helping you debug and improve agent reliability.
Can I use Evaluator Rules with any integration method?
Can I use Evaluator Rules with any integration method?
Yes, Evaluator Rules work with spans and traces from all integration methods—LangGraph SDK, Strands SDK, and OpenTelemetry.
Limitations and Considerations
Fiddler Agentic Observability has some current limitations:- Protocol support: Currently uses HTTP-based OTLP; gRPC support planned for future releases
- Attribute limits: Default limits prevent oversized spans; configurable for high-volume use cases
- Language support: LangGraph and Strands SDKs are Python-only; use OpenTelemetry for other languages
Next Steps
- Quick Start Guides: Choose the quick start applicable to your use case
- SDK References: Complete technical documentation for all SDK components