Fiddler LangGraph SDK Quick Start

Instrument your LangGraph or LangChain application with the Fiddler LangGraph SDK in under 10 minutes.

What You'll Learn

By completing this quick start, you'll:

  • Set up monitoring for a LangGraph or LangChain application

  • Send your first traces to Fiddler

  • Verify data collection in the Fiddler dashboard

  • Understand basic conversation tracking

Prerequisites

Before you begin, ensure you have:

  • Python 3.10 or higher (up to Python 3.13)

  • Valid Fiddler account with access to your instance

  • A LangGraph or LangChain application ready for instrumentation

  • Network connectivity to your Fiddler instance over HTTPS on TCP port 443

Validate your setup

Before proceeding, verify:

  • Python version: python --version (should show 3.10+)

  • Network access: Can you reach your Fiddler instance URL? ping https://your-instance.fiddler.ai

  • LangGraph installation: python -c "import langgraph; print('LangGraph available')"

  • Or LangChain installation: python -c "import langchain; print('LangChain available')"

Step 1: Set Up Your Fiddler Application

  1. Create your application in Fiddler

    Log in to your Fiddler instance and navigate to GenAI Apps, then select Add Application.

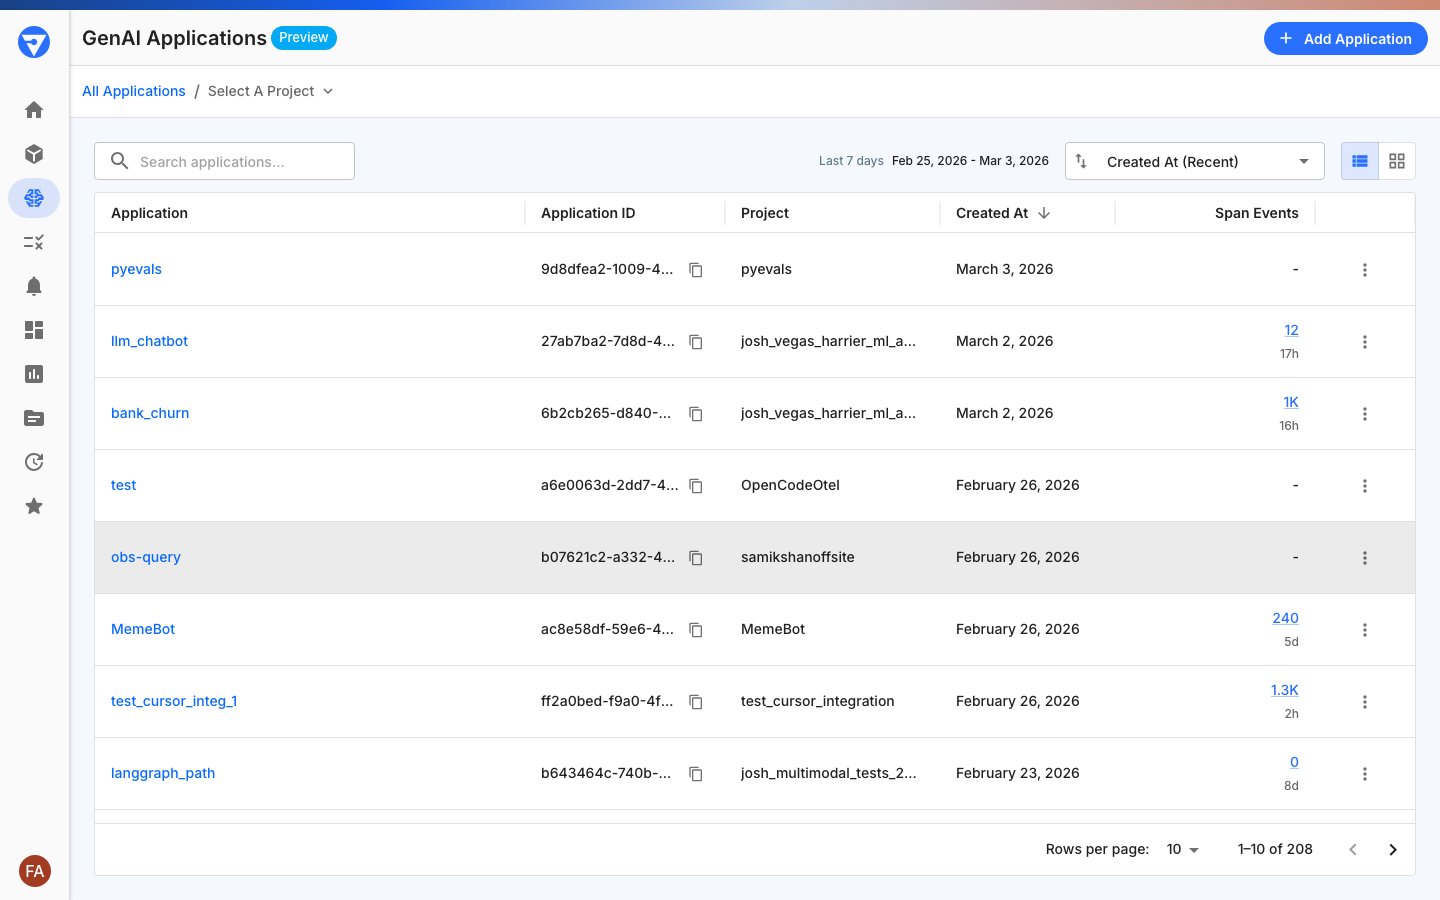
  2. Copy your Application ID

    After creating your application, copy the Application ID from the application details page. This must be a valid UUID4 format (for example, 550e8400-e29b-41d4-a716-446655440000). You'll need this for Step 3.

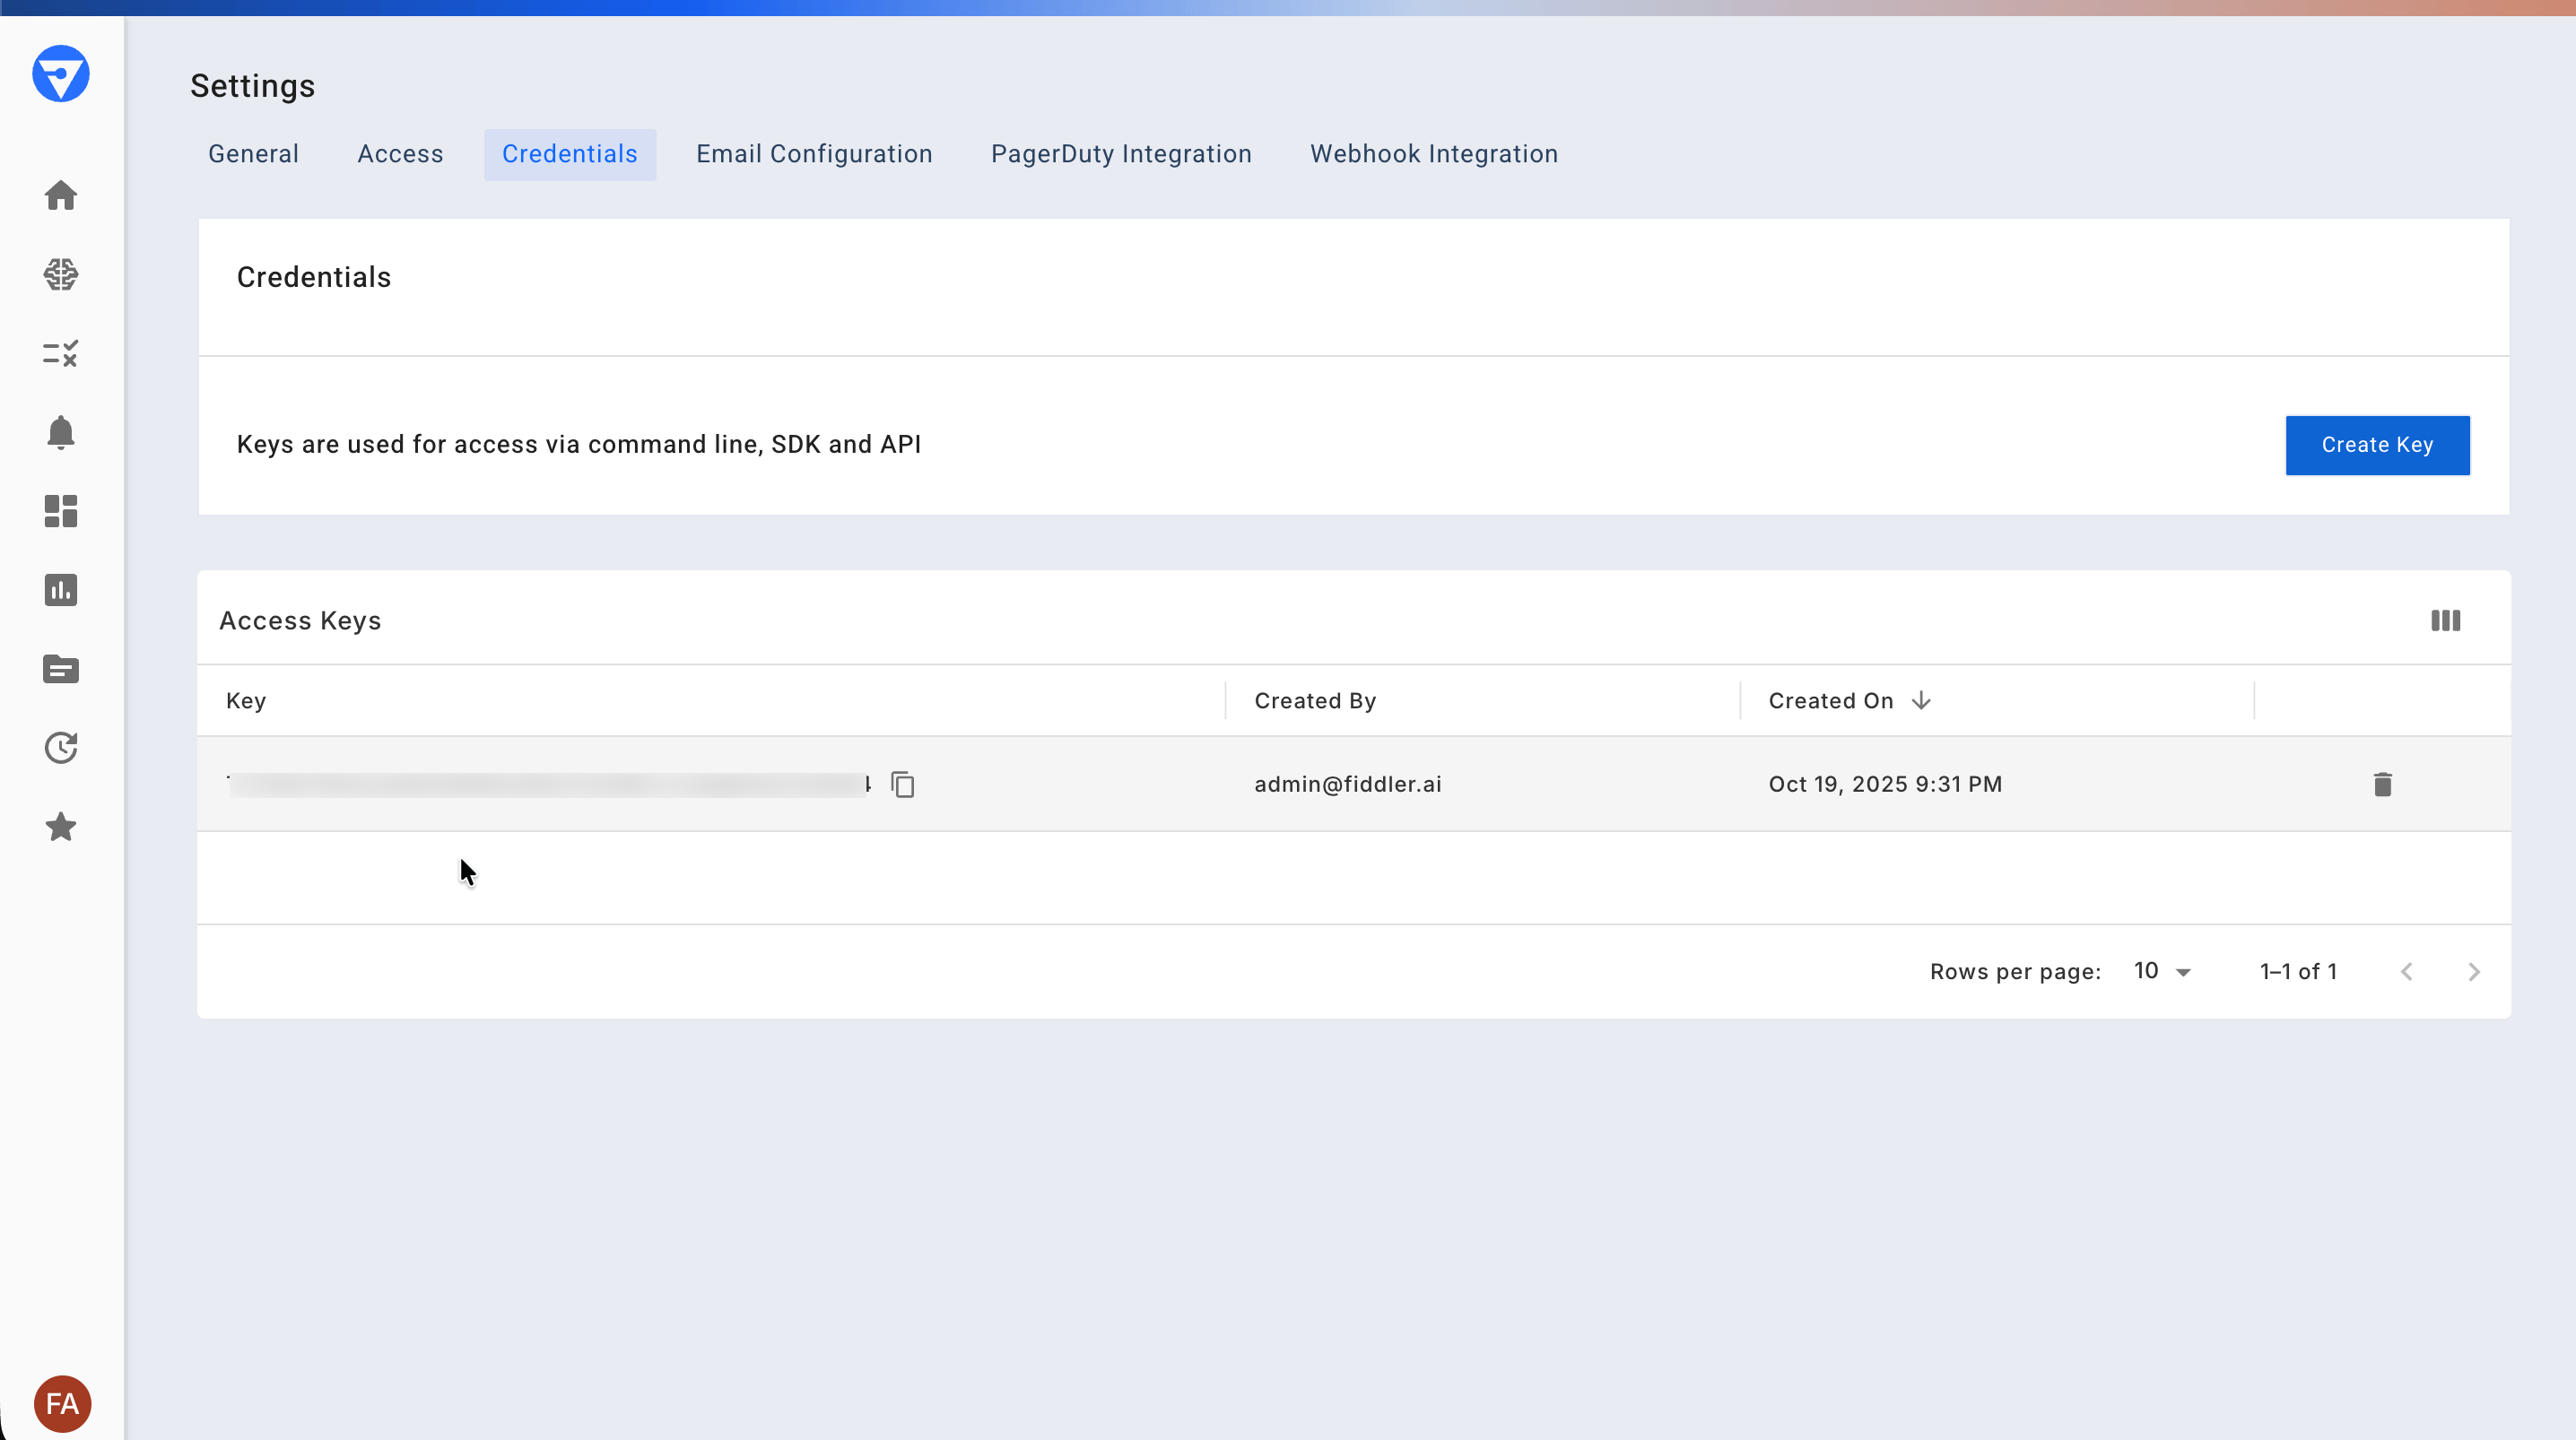
  3. Get Your Access Token

    Go to Settings > Credentials and copy your access token. You'll need this for Step 3. Refer to the documentation for more details.

Step 2: Install the Fiddler LangGraph SDK

Standard Installation

For the stable release, install the Fiddler LangGraph SDK using pip:

pip install fiddler-langgraph

Beta Installation (current)

During the beta period, install from the test repository:

pip install \
    --index-url https://test.pypi.org/simple/ \
    --extra-index-url https://pypi.org/simple \
    fiddler-langgraph==0.1.0a16

Use the beta installation command while the SDK is in private preview. We'll update this documentation when the stable version becomes available.

Step 3: Instrument Your Application

Add the Fiddler LangGraph SDK to your LangGraph or LangChain application with just a few lines of code:

import os
from fiddler_langgraph import FiddlerClient
from fiddler_langgraph.tracing.instrumentation import LangGraphInstrumentor

# Initialize the FiddlerClient with environment variables (recommended)
fdl_client = FiddlerClient(
    api_key=os.getenv("FIDDLER_API_KEY"),  # Your access token
    application_id=os.getenv("FIDDLER_APPLICATION_ID"),  # UUID4 from Step 1
    url=os.getenv("FIDDLER_URL")  # https://your-instance.fiddler.ai
)

# Instrument your application
instrumentor = LangGraphInstrumentor(fdl_client)
instrumentor.instrument()

# Your existing LangGraph code runs normally
# Traces will automatically be sent to Fiddler

LangChain Application Support

The SDK supports both LangGraph and LangChain applications. While agent names are automatically extracted from LangGraph applications by the SDK, LangChain applications need the agent name to be explicitly set using the configuration parameter:

from langchain_core.output_parsers import StrOutputParser

# Define your LangChain runnable using LangChain Expression Language (LCEL)
chat_app_chain = prompt | llm | StrOutputParser()

# Run with agent name configuration
response = chat_app_chain.invoke({
    "input": user_input,
    "history": messages,
}, config={"configurable": {"agent_name": "service_chatbot"}})

Important: If you don't provide an agent name for LangChain applications, it will appear as "UNKNOWN_AGENT" in the Fiddler UI. All other features including conversation ID, LLM context, and attribute structure work the same as with LangGraph.

Set Environment Variables

For security and flexibility, set these environment variables:

export FIDDLER_API_KEY="your-access-token"
export FIDDLER_APPLICATION_ID="your-uuid4-application-id"
export FIDDLER_URL="https://your-instance.fiddler.ai"

For DevOps teams: Consider using environment variables for production deployments to avoid hardcoding credentials.

Add Context and Conversation Tracking

The main goal of context setting is to enrich the telemetry data sent to Fiddler:

from fiddler_langgraph.tracing.instrumentation import set_llm_context, set_conversation_id
import uuid

# Set descriptive context for LLM processing
set_llm_context(model, "Customer support conversation")

# Set conversation ID for tracking multi-turn conversations
conversation_id = str(uuid.uuid4())
set_conversation_id(conversation_id)

For AI engineers: The conversation tracking feature supports multi-turn agent interactions and helps trace decision flows across agent sessions.

Step 4: Run a Complete Example

This example requires an OpenAI API key. You can create or find your key on the API keys page of your OpenAI account.

Here's a complete working example to verify your setup:

import os
import uuid
from fiddler_langgraph import FiddlerClient
from fiddler_langgraph.tracing.instrumentation import (
    LangGraphInstrumentor,
    set_llm_context,
    set_conversation_id
)
from langchain_openai import ChatOpenAI
from langgraph.prebuilt import create_react_agent

# Initialize the Fiddler LangGraph SDK client
fdl_client = FiddlerClient(
    api_key=os.getenv("FIDDLER_API_KEY"),
    application_id=os.getenv("FIDDLER_APPLICATION_ID"),
    url=os.getenv("FIDDLER_URL")
)

# Instrument the application
instrumentor = LangGraphInstrumentor(fdl_client)
instrumentor.instrument()

# Create your agent
model = ChatOpenAI(model="gpt-4o-mini")
agent = create_react_agent(model, tools=[])

# Set descriptive context for this interaction
set_llm_context(model, "Quick start example conversation")

# Generate and set a conversation ID
conversation_id = str(uuid.uuid4())
set_conversation_id(conversation_id)

# Run your agent - automatically instrumented
result = agent.invoke({
    "messages": [{"role": "user", "content": "Hello! How are you?"}]
})

print("Response received:", result)
print("Conversation ID:", conversation_id)

What This Example Demonstrates

  • Client initialization: Connects to your Fiddler instance

  • Automatic instrumentation: Captures agent execution without code changes

  • Context enrichment: Adds meaningful labels to your traces

  • Conversation tracking: Links related interactions together

Step 5: Verify Monitoring is Working

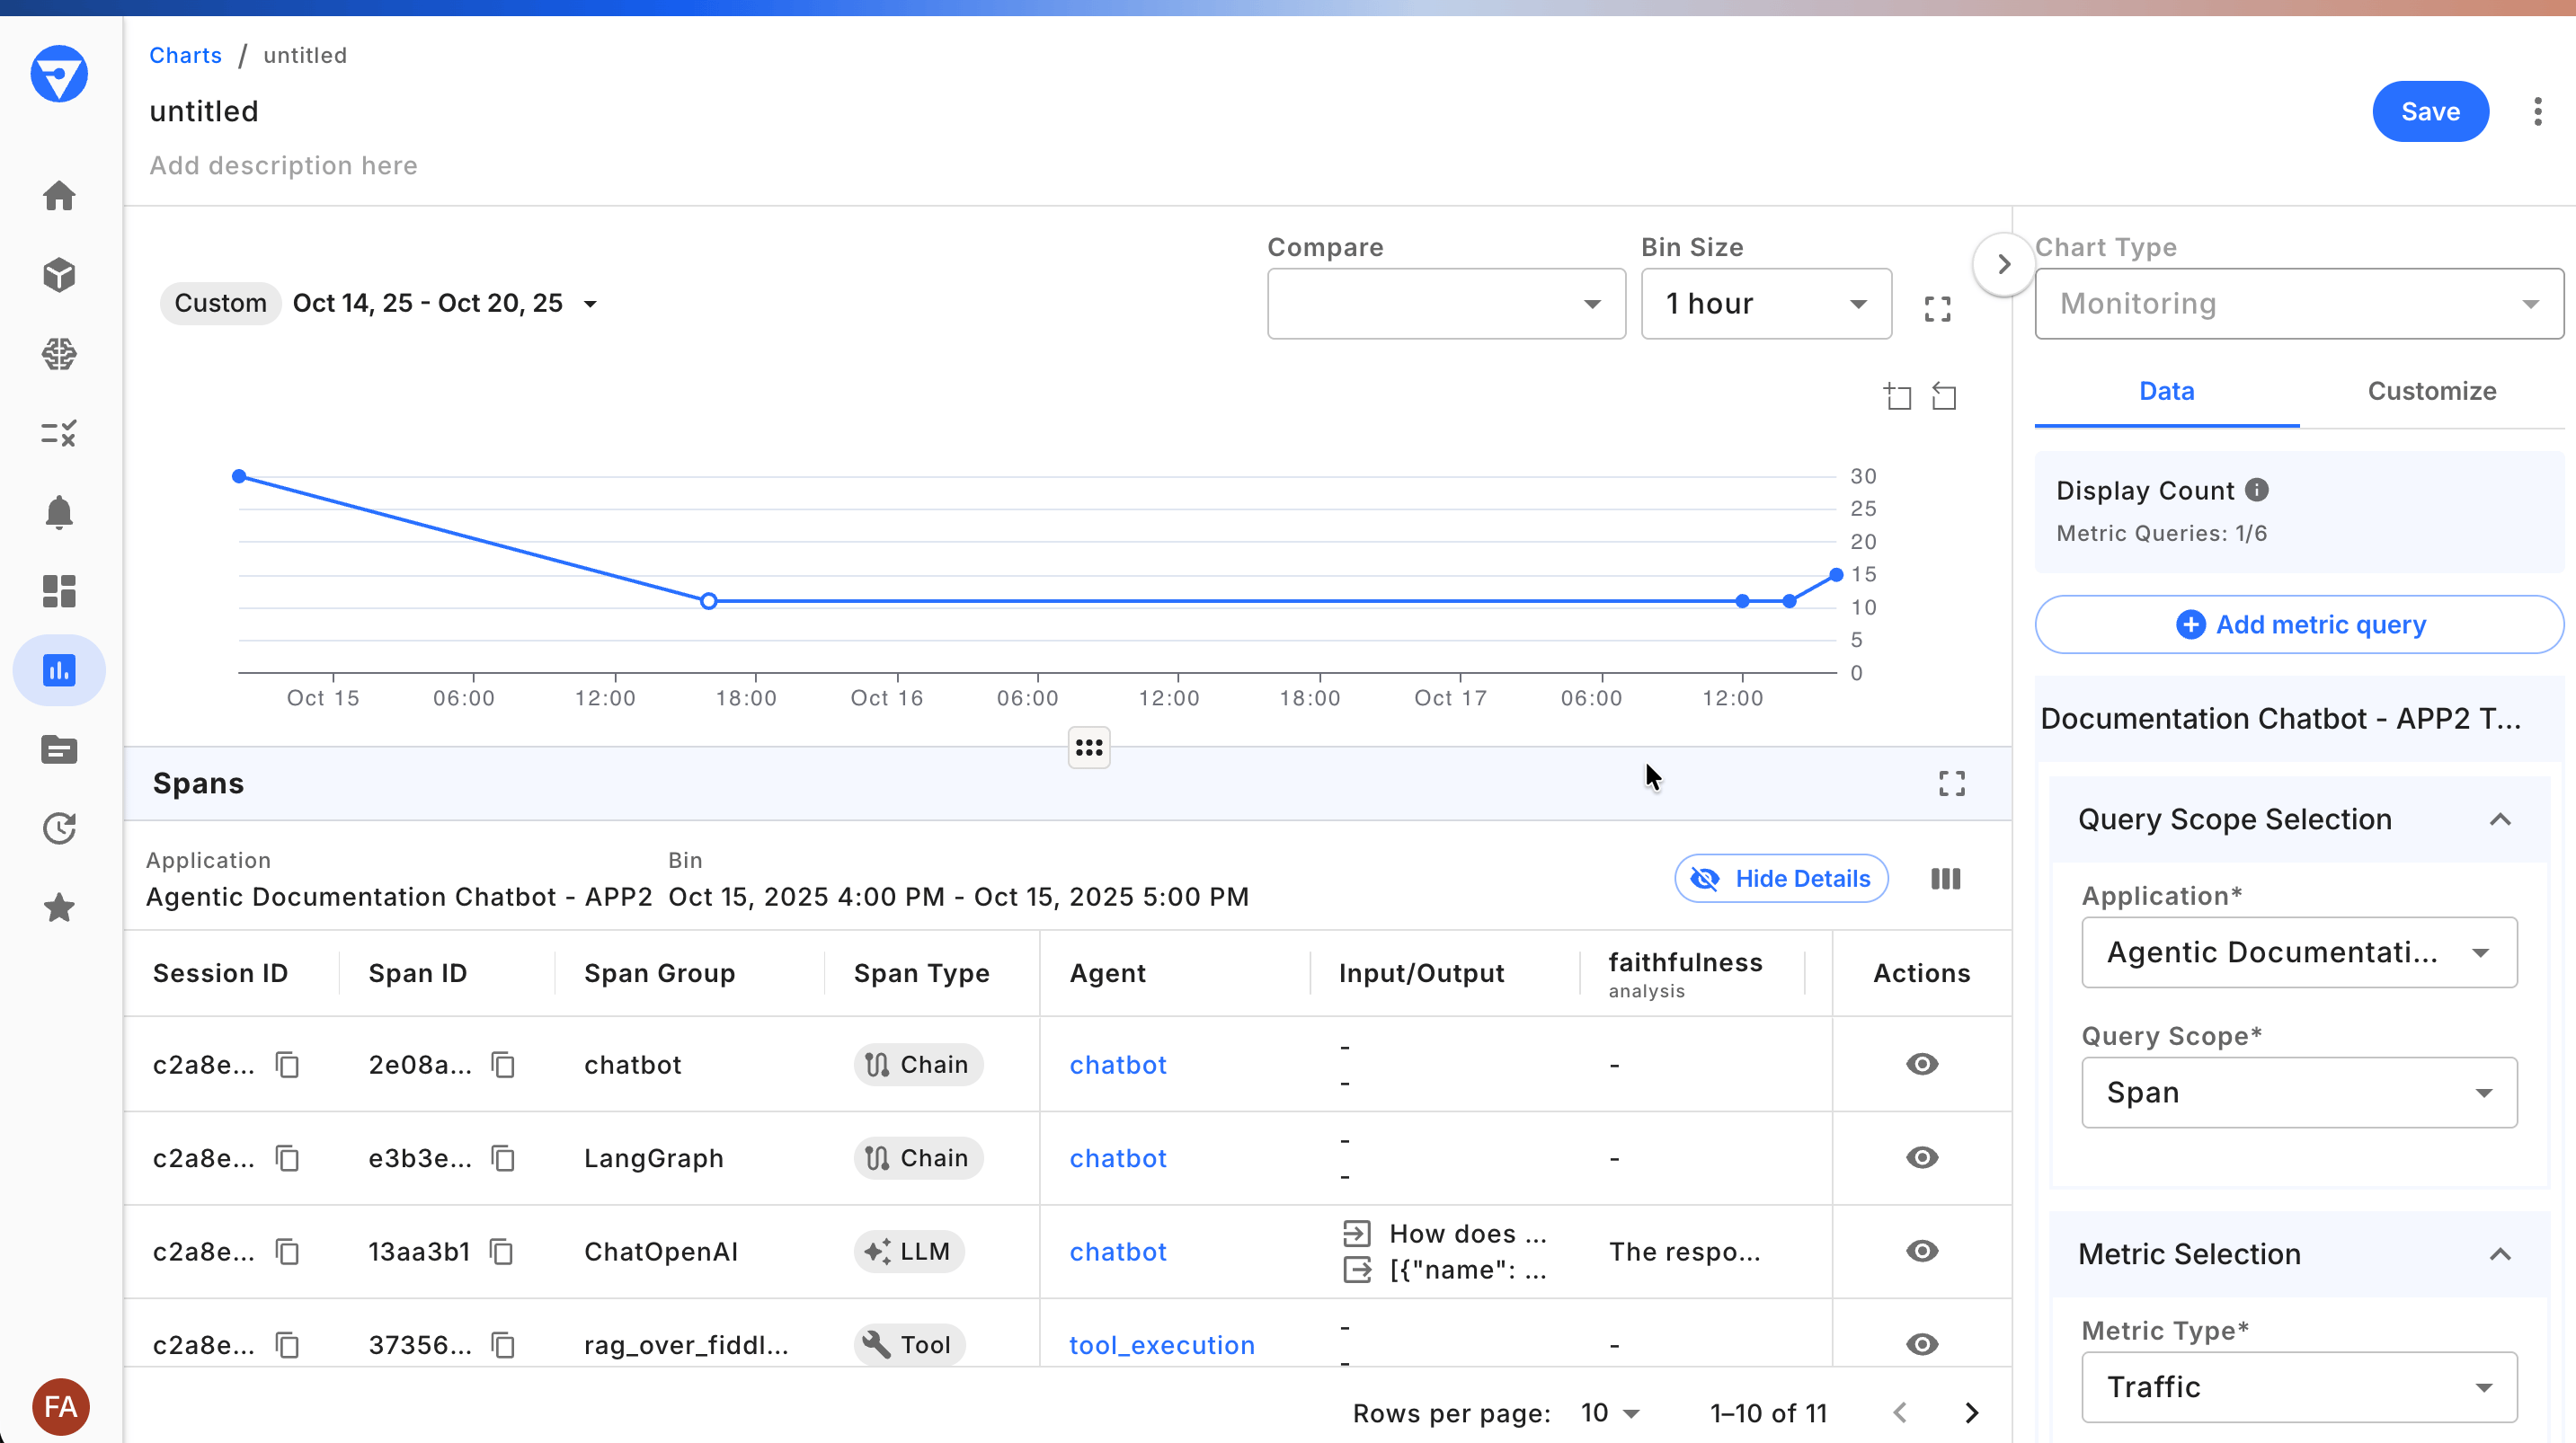
  1. Run your application using the example above or your own instrumented code

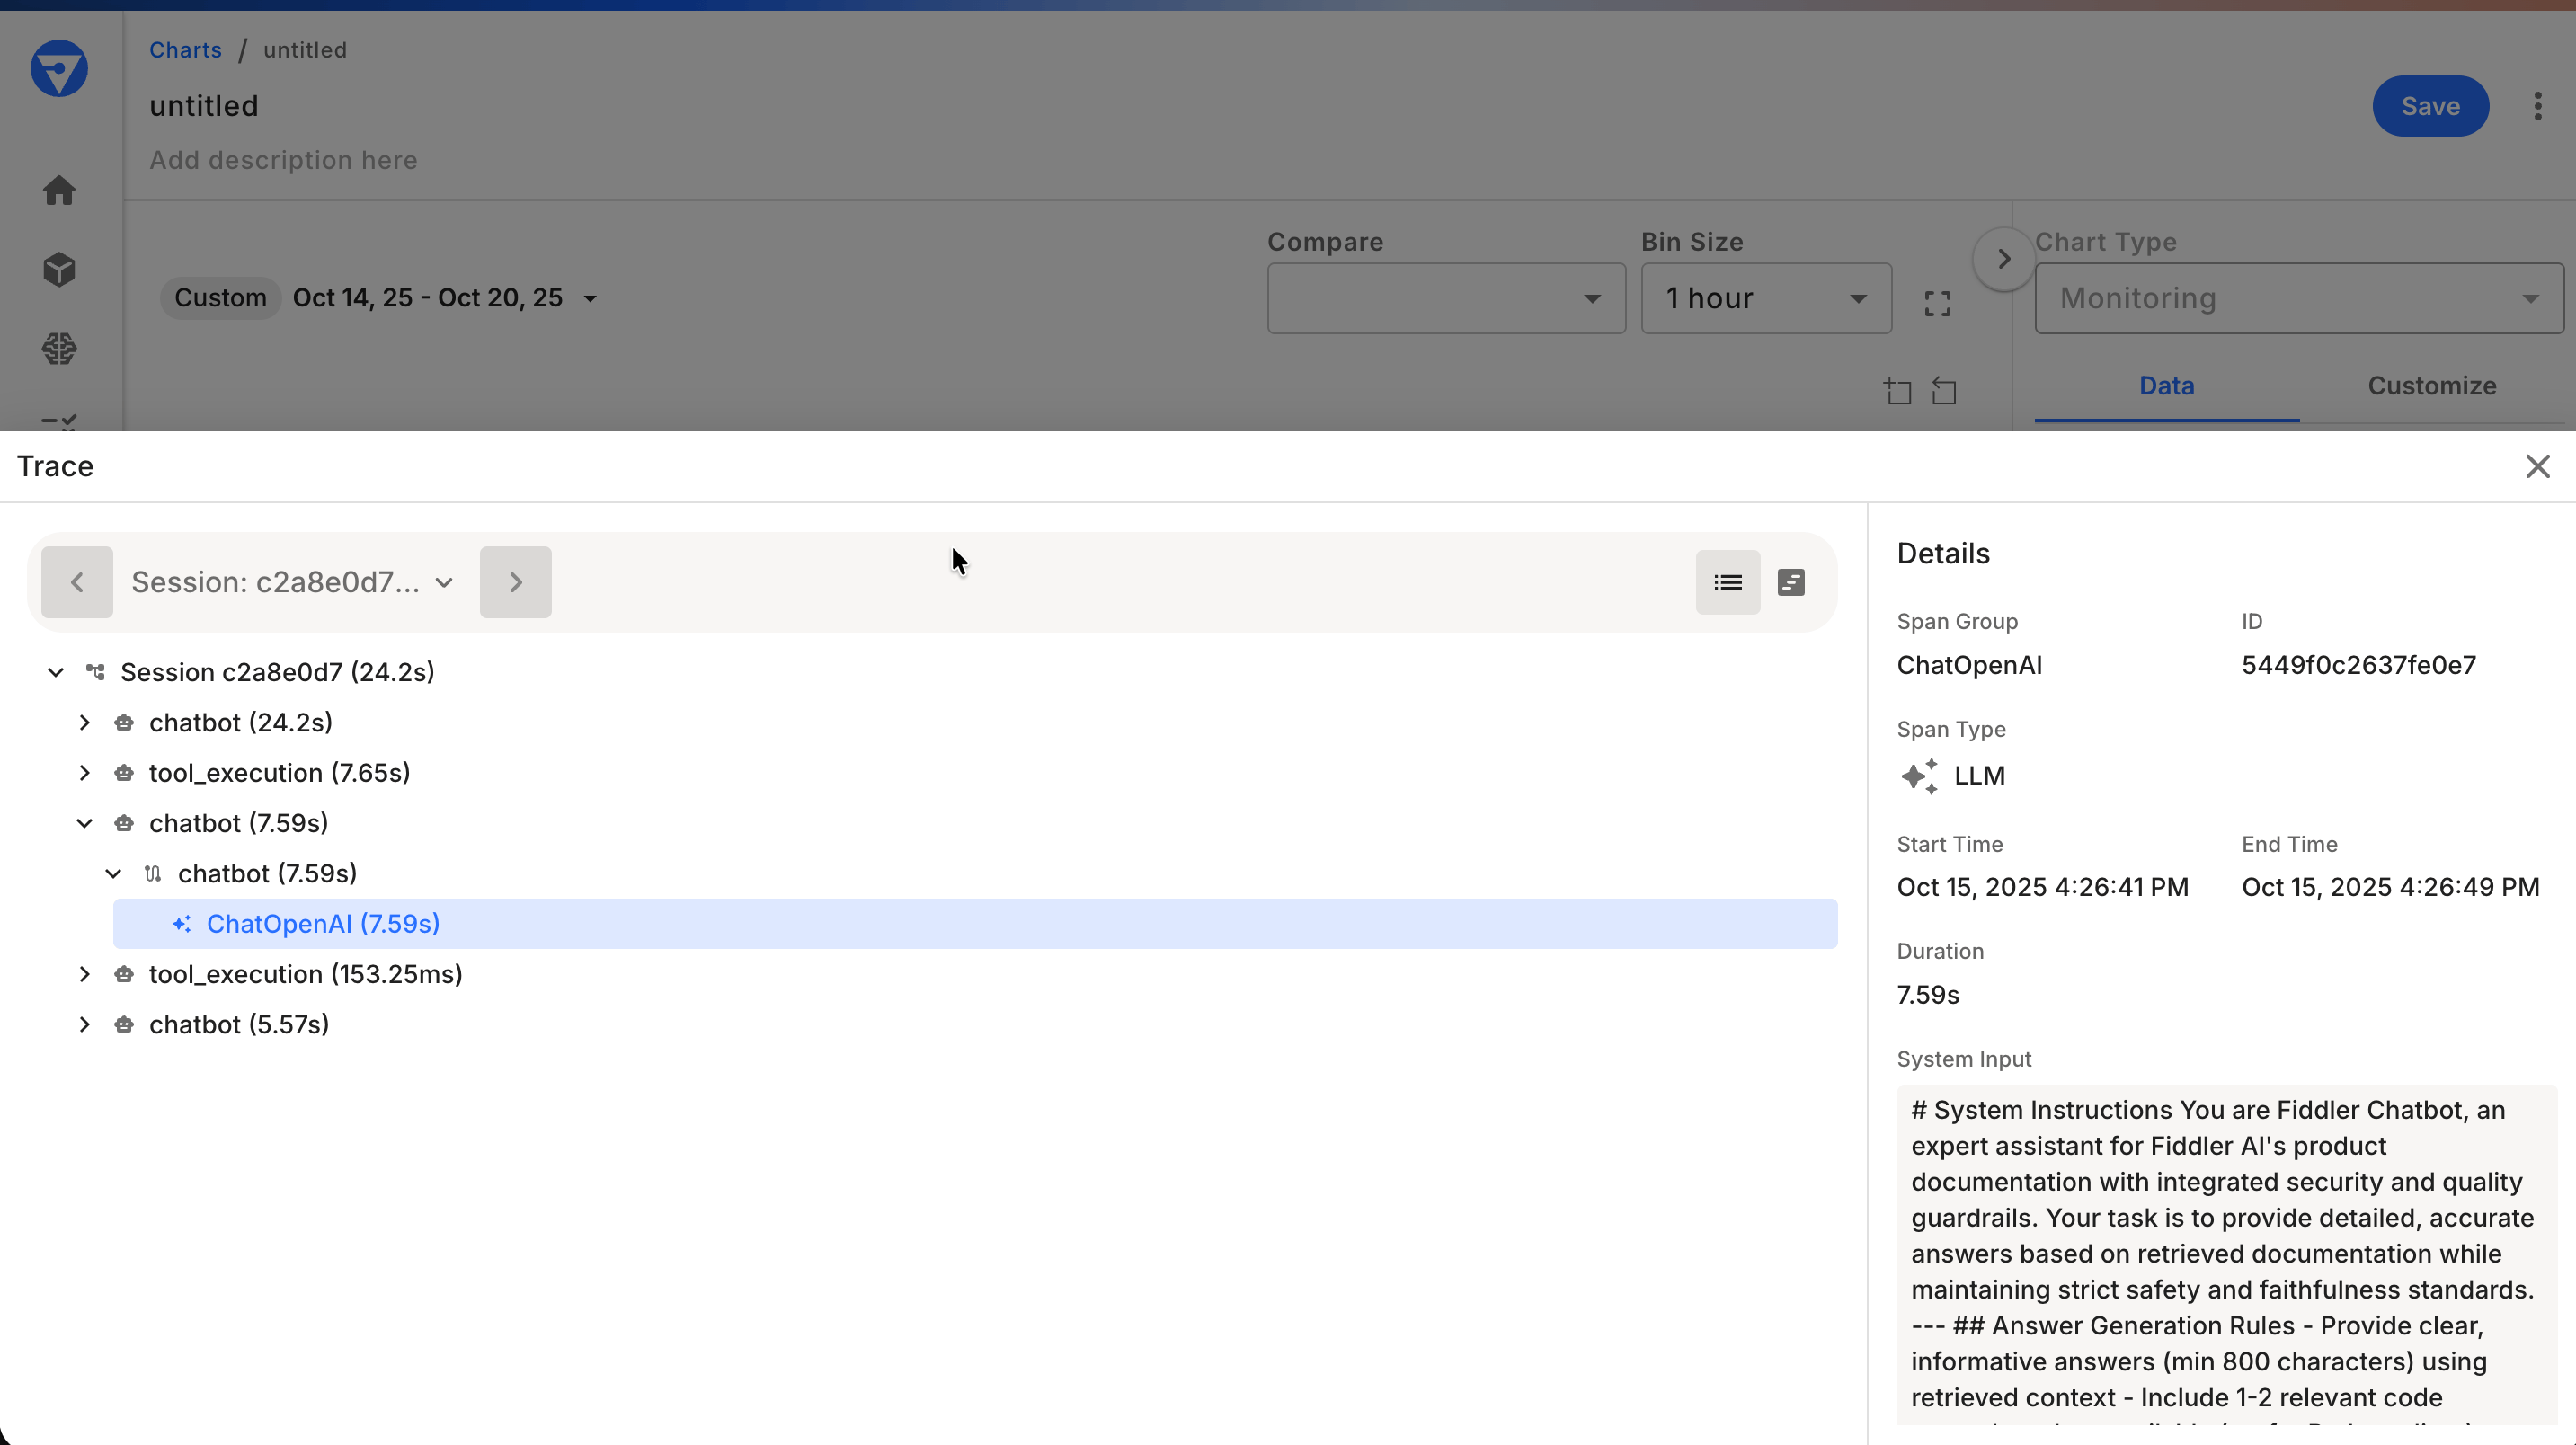
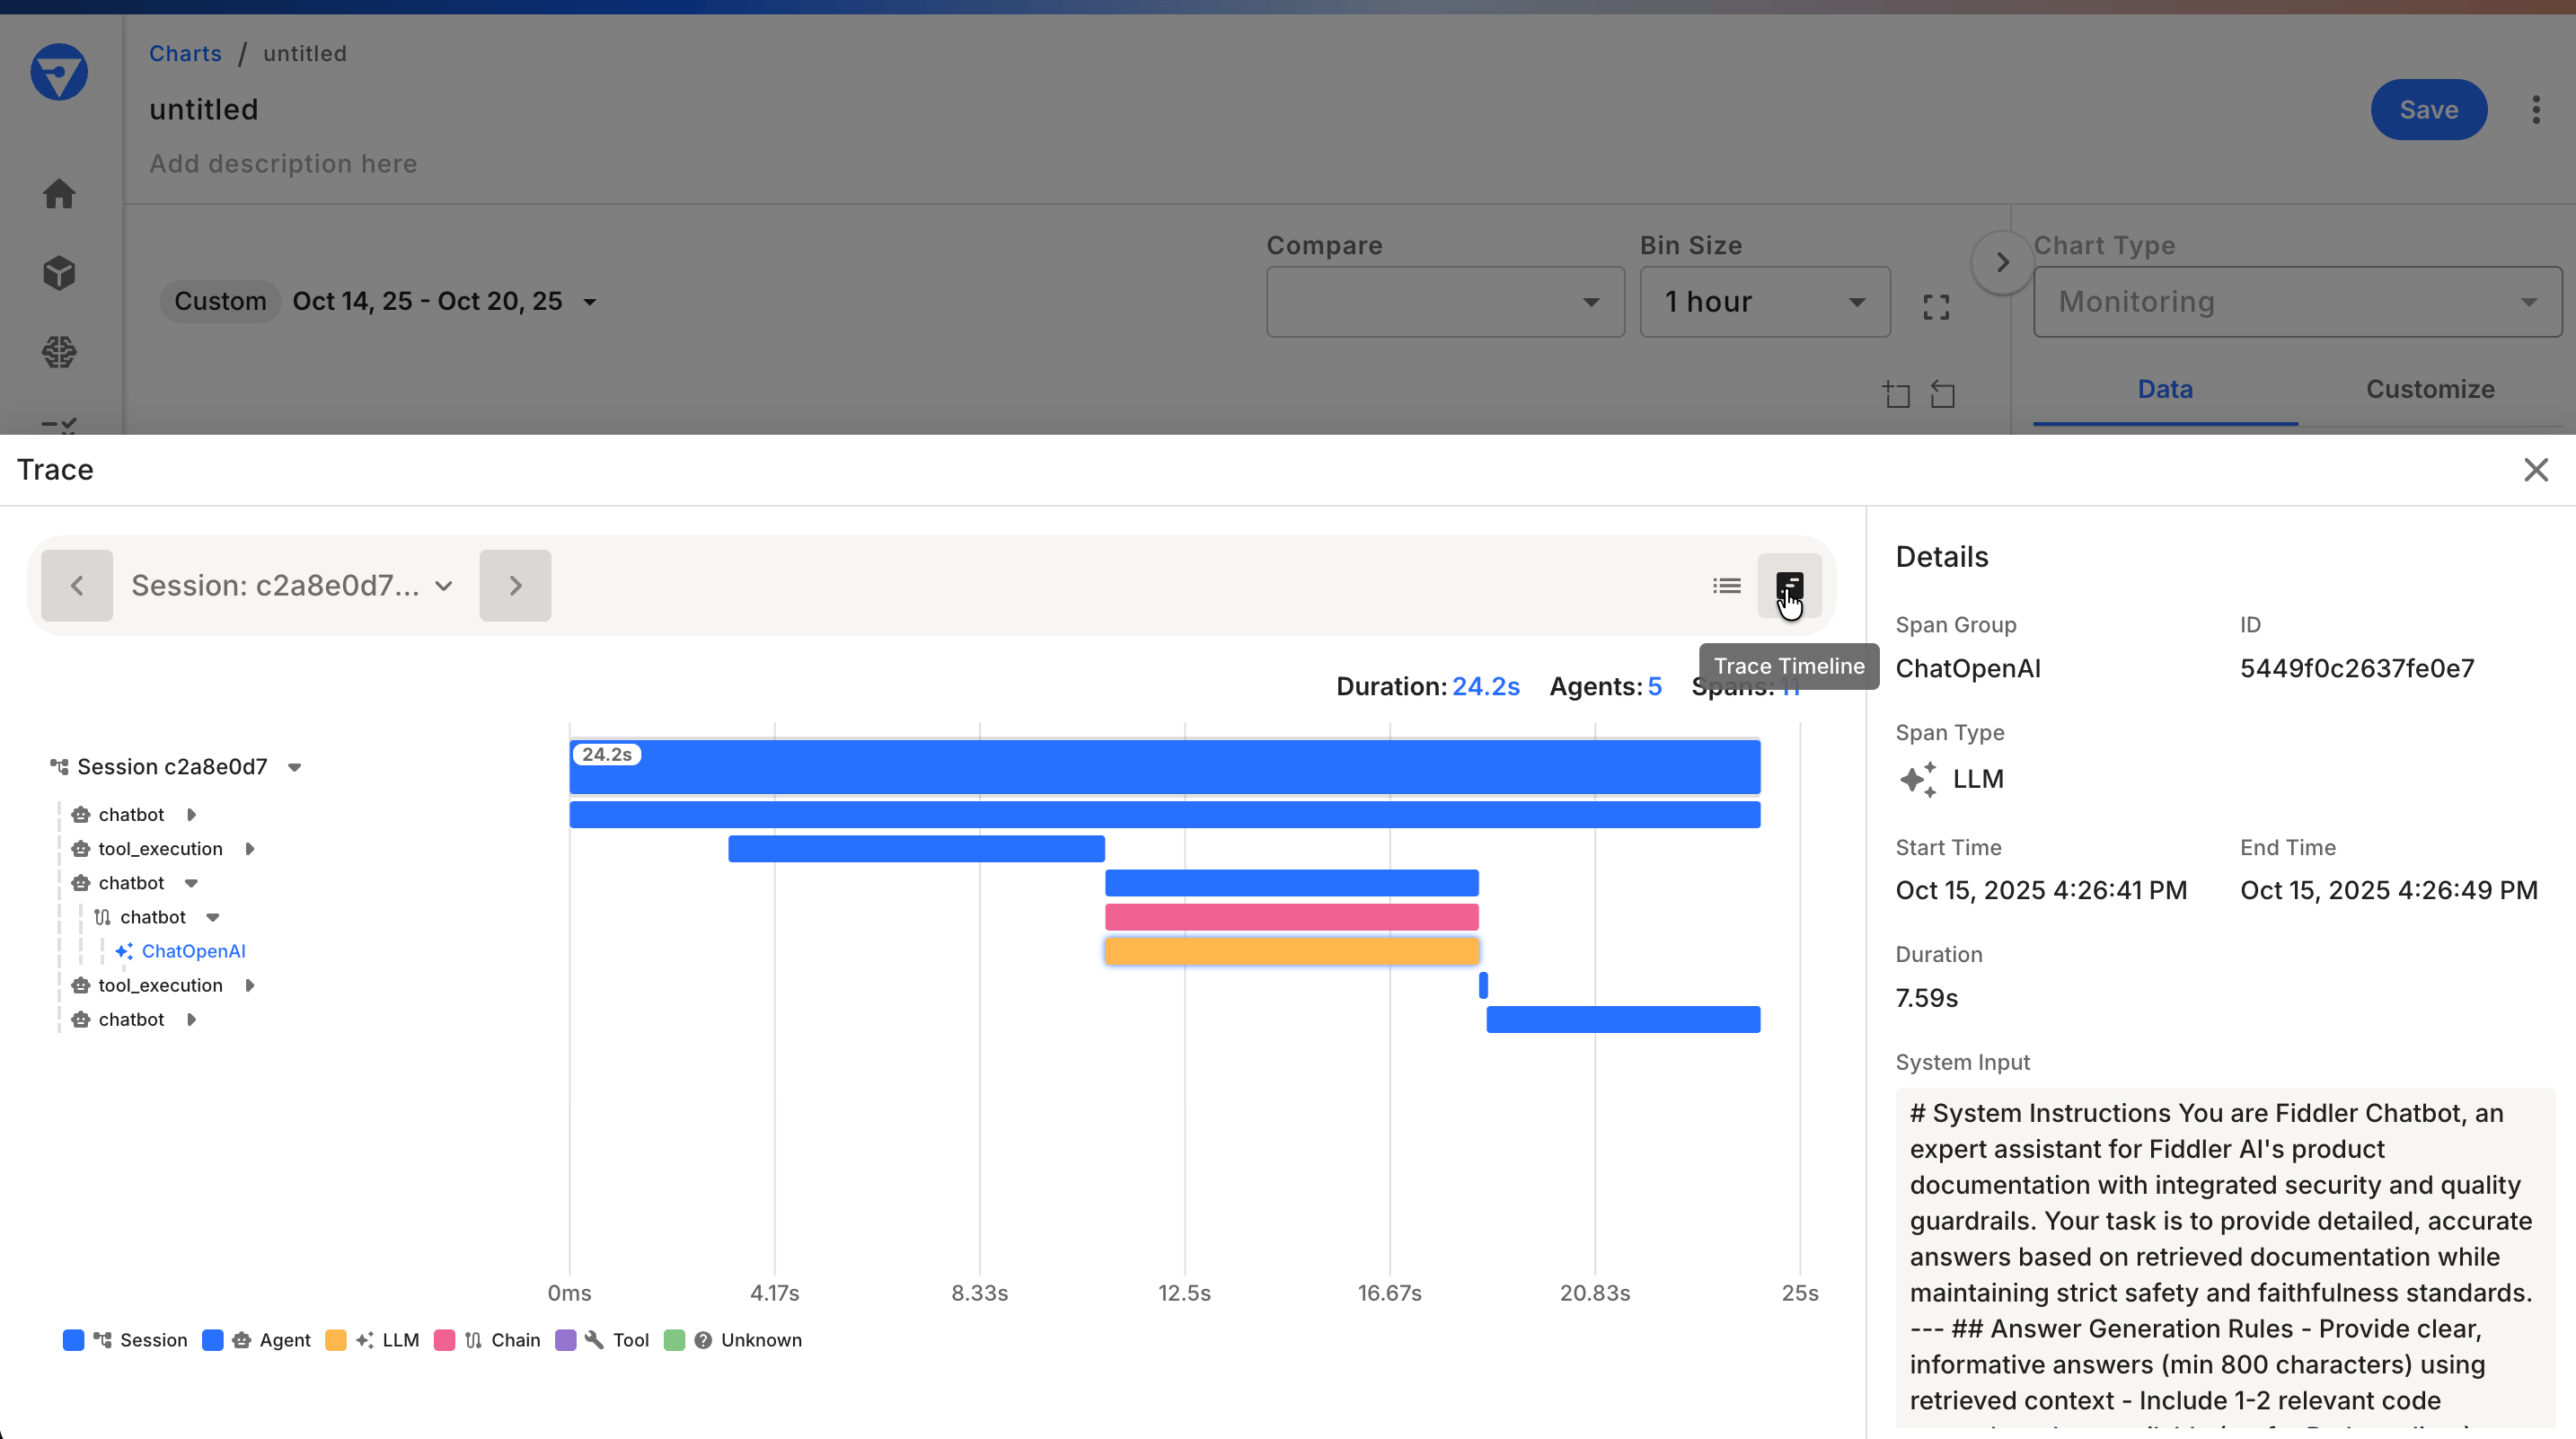
  2. Check the Fiddler dashboard: Navigate to GenAI Apps in your Fiddler instance

  3. Confirm active status: If Fiddler successfully receives telemetry, your application will show as Active

Success Criteria

You should see:

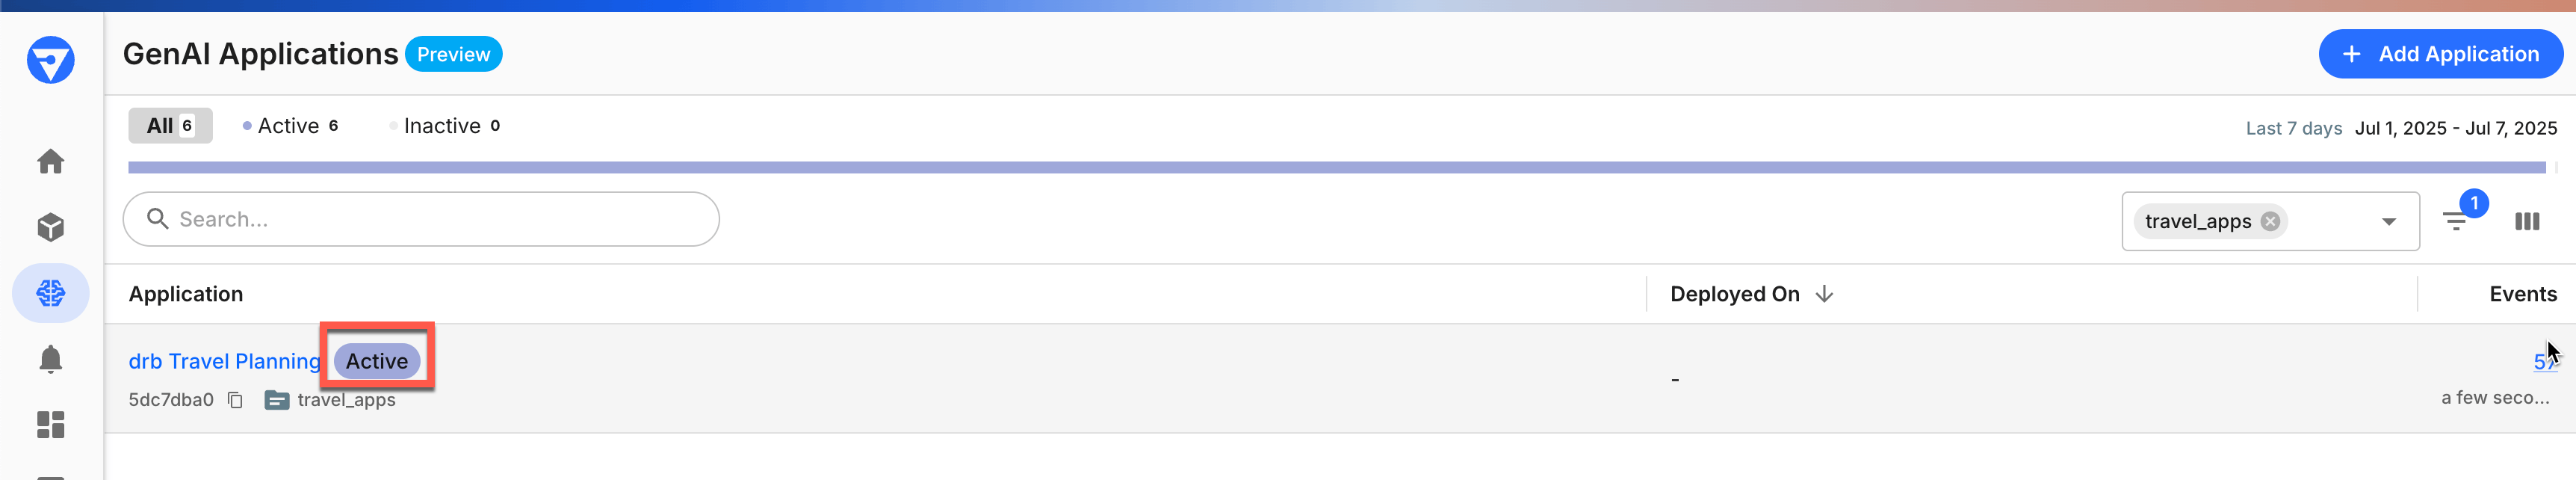
  • Application status changed to Active in the Fiddler dashboard

  • Trace data appearing within 1-2 minutes of running your example

  • Context labels matching what you set in your code

  • Conversation ID visible in the trace details

Step 6: Grant Team Access (optional)

Provide access to other users by assigning teams and users to the project that contains your applications. Managing permissions through teams is recommended as a best practice. For more access control details, refer to our Role-based Access Guide.

  1. Open the Settings page and select the Access tab

  2. For both Users and Teams, select the "Edit" option to the right of the name

  3. Add appropriate team members with the required permission levels

Troubleshooting

Common Issues and Solutions

Problem: Application shows as "Inactive"

  • Ensure your application executes instrumented code

  • Verify that your Fiddler access token and application ID are correct

  • Check network connectivity to your Fiddler instance

  • Enable console tracer to see if traces are being generated locally:

    fdl_client = FiddlerClient(..., console_tracer=True)

Problem: Import errors

  • Verify Python version is 3.10 or higher

  • Ensure LangGraph is installed and compatible (versions >= 0.3.28 and < 0.5.2)

  • Try reinstalling the SDK: pip uninstall fiddler-langgraph && pip install fiddler-langgraph

Problem: Invalid Application ID

  • Ensure your application ID is in proper UUID4 format

  • Copy the ID directly from the Fiddler dashboard

  • Verify the application exists in your Fiddler instance

Problem: Network connectivity issues

  • Test connectivity: curl -I https://your-instance.fiddler.ai

  • Check firewall settings for HTTPS traffic on port 443

  • Verify your Fiddler instance URL is correct

Problem: Agent appears as "UNKNOWN_AGENT" in Fiddler UI

  • For LangChain applications, ensure you're setting the agent name in the config parameter

    • Example: config={"configurable": {"agent_name": "your_agent_name"}}

Next Steps

Now that your application is instrumented:

  1. Explore the data: Check your Fiddler dashboard for traces, metrics, and performance insights

  2. Learn advanced features: See our Advanced Usage Tutorial for complex multi-agent scenarios

  3. Review the SDK reference: Check the Fiddler LangGraph SDK Reference for complete documentation

  4. Optimize for production: Review configuration options for high-volume applications

Support

  • Questions? Contact us at [email protected]

  • Feature requests? We'd love to hear your feedback on the SDK

  • Documentation issues? Report problems or suggest improvements through our support channels

Configuration Options

Basic Configuration

from fiddler_langgraph import FiddlerClient

fdl_client = FiddlerClient(
    api_key="your-api-key",
    application_id="your-app-id",  # Must be valid UUID4
    url="https://your-instance.fiddler.ai"
)

Advanced Configuration

Customize Limits for High-Volume Applications

Set limits for your events, spans, and associated attributes. This is helpful for tuning reporting data to manageable numbers for highly attributed and/or high-volume applications.

from opentelemetry.sdk.trace import SpanLimits
from fiddler_langgraph import FiddlerClient

# Custom span limits for high-volume applications
custom_limits = SpanLimits(
    max_events=64,            # Default: 32
    max_links=64,             # Default: 32
    max_span_attributes=64,   # Default: 32
    max_event_attributes=64,  # Default: 32
    max_link_attributes=64,   # Default: 32
    max_span_attribute_length=4096, # Default: 2048
)

client = FiddlerClient(
    api_key="your-api-key",
    application_id="your-app-id",  # Must be valid UUID4
    url="https://your-instance.fiddler.ai",
    span_limits=custom_limits,
)

Sampling Traffic

Set a specific percentage for sampling the incoming data.

from opentelemetry.sdk.trace import sampling
from fiddler_langgraph import FiddlerClient

# Sampling strategy for production
sampler = sampling.TraceIdRatioBased(0.1)  # Sample 10% of traces

client = FiddlerClient(
    api_key="your-api-key",
    application_id="your-app-id",  # Must be valid UUID4
    url="https://your-instance.fiddler.ai",
    sampler=sampler,
)

Environment Variables for Batch Processing

Adjust the following environment variables the FiddlerClient will use when processing the OpenTelemetry traffic.

import os
from fiddler_langgraph import FiddlerClient

# Configure batch processing
os.environ['OTEL_BSP_MAX_QUEUE_SIZE'] = '500'         # Default: 100
os.environ['OTEL_BSP_SCHEDULE_DELAY_MILLIS'] = '500'  # Default: 1000
os.environ['OTEL_BSP_MAX_EXPORT_BATCH_SIZE'] = '50'   # Default: 10
os.environ['OTEL_BSP_EXPORT_TIMEOUT'] = '10000'       # Default: 5000

client = FiddlerClient(
    api_key="your-api-key",
    application_id="your-app-id",  # Must be valid UUID4
    url="https://your-instance.fiddler.ai",
)

Compression Options

The SDK supports data compression to help reduce the overall data volume transmitted over the network. This can help improve network latency.

from opentelemetry.exporter.otlp.proto.http.trace_exporter import Compression
from fiddler_langgraph import FiddlerClient

# Enable gzip compression (default, recommended for production)
client = FiddlerClient(
    api_key="your-api-key",
    application_id="your-app-id",  # Must be valid UUID4
    url="https://your-instance.fiddler.ai",
    compression=Compression.Gzip,
)

# Disable compression (useful for debugging or local development)
client = FiddlerClient(
    api_key="your-api-key",
    application_id="your-app-id",  # Must be valid UUID4
    url="https://your-instance.fiddler.ai",
    compression=Compression.NoCompression,
)

# Use deflate compression (alternative to gzip)
client = FiddlerClient(
    api_key="your-api-key",
    application_id="your-app-id",  # Must be valid UUID4
    url="https://your-instance.fiddler.ai",
    compression=Compression.Deflate,
)

Troubleshooting

Common Installation Issues

Problem: ModuleNotFoundError: No module named 'fiddler_langgraph'

  • Solution: Ensure you've installed the correct package: pip install fiddler*langgraph

Problem: Version conflicts with existing packages

  • Solution: Use a virtual environment or update conflicting packages

Common Configuration Issues

Problem: ValueError: application_id must be a valid UUID4

  • Solution: Ensure your Application ID is a valid UUID4 format (e.g., 550e8400-e29b-41d4-a716-446655440000)

Problem: ValueError: URL must have a valid scheme and netloc

  • Solution: Ensure your URL includes the protocol (e.g., https://your-instance.fiddler.ai)

Problem: Connection errors or timeouts

  • Solution: Check your network connectivity and Fiddler instance URL

  • Debug: Enable console tracer for local debugging:

    fdl_client = FiddlerClient(
        api_key="your-api-key",
        application_id="your-app-id",
        console_tracer=True  # Enables local debug output (disables push to Fiddler)
    )

    Note: Enabling local tracing to the console will result in the data not getting sent to Fiddler

Import Issues

Problem: ImportError: cannot import name 'LangGraphInstrumentor'

  • Solution: Ensure you have the correct import path:

    from fiddler_langgraph.tracing.instrumentation import LangGraphInstrumentor

Verification Issues

Problem: Application not showing as "Active" in Fiddler

  • Solution: Check the following:

    1. Ensure your application executes instrumented code

    2. Verify that your Fiddler access token and application ID are correct

    3. Check network connectivity to your Fiddler instance

    4. Enable console tracer to see if traces are being generated locally

Next Steps

Now that your application is instrumented:

  1. Explore the data: Check your Fiddler dashboard for traces and metrics

  2. Learn advanced features: See our Tutorial: Advanced Usage for more complex scenarios

  3. Review the SDK: Check the Fiddler LangGraph SDK Reference for complete documentation

  4. Optimize for production: Review configuration options for high-volume applications

Support

  • Questions? Contact us at [email protected]

  • Feature requests? We'd love to hear your feedback on the SDK